Due to increasing gas prices and environmental concerns, battery propelled electric vehicles (BEVs) and hybrid electric vehicles (HEVs) have recently drawn more attention. In BEV and HEV configurations, the rechargeable energy storage system (RESS) is a key design issue [1–3]. Thus, the system should be able to have good performances in terms of energy density and power capabilities during acceleration and braking phases. However, the thermal stability, charge capabilities, life cycle and cost can be considered also as essential assessment parameters for RESS systems.
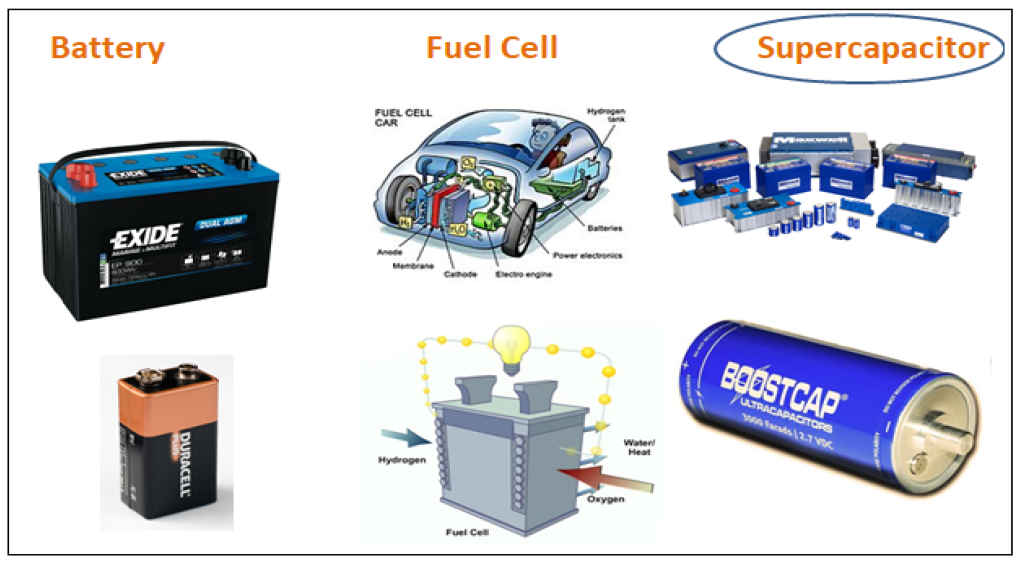
Presently batteries are used as energy storage devices in most applications. These batteries should be sized to meet the energy and power requirements of the vehicle. Furthermore, the battery should have good life cycle performances. However, in many BEV applications the required power is the key factor for battery sizing, resulting in an over-dimensioned battery pack [4,5] and less optimal use of energy [4]. These shortcomings could be solved by combination of battery system with supercapacitors [6–8]. In [9], it is documented that such hybridization topologies can result into enhancing the battery performances by increasing its life cycle, rated capacity, reducing the energy losses and limiting the temperature rising inside the battery. Omar et al. concluded that these beneficial properties are due to the averaging of the power provided by the battery system [4,6,9]. However, the implementation of supercapacitors requires a bidirectional DC–DC converter, which is still expensive. Furthermore, such topologies need a well-defined energy flow controller (EFC). Price, volume and low rated voltage (2.5–3 V) hamper the combination of battery with supercapacitors [6,10]. In order to overcome these difficulties, Cooper et al. introduced the Ultra-Battery, which is a combination of lead-acid and supercapacitor in the same cell [11]. The new system encompasses a part asymmetric and part conventional negative plate. The proposed system allows to deliver and to absorb energy at very high current rates. The Ultra-Batteries have been tested successfully in the Honda Insight. However, this technology is still under development. In the last decade, a number of new lithium-ion battery chemistries have been proposed for vehicular applications. In [12–15], it is reported that the most relevant lithium-ion chemistries in vehicle applications are limited to lithium iron phosphate (LFP), lithium nickel manganese cobalt oxide (NMC), lithium nickel cobalt aluminum oxide (NCA), lithium manganese spinel in the positive electrode and lithium titanate oxide (LTO) in the negative electrode. In this chapter, the performance and characteristics of various lithium-ion based batteries and supercapacitor will be evaluated and discussed. The evaluation will be mainly based on the electrical behavior. Then the characteristics of these RESS systems will be investigated based on the electrical and thermal models.
Batteries
Electrical characterization
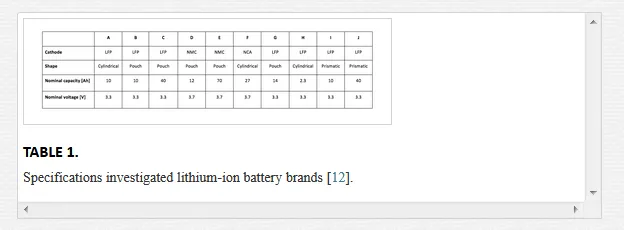
It is well known that the key consideration in the design of rechargeable energy storage systems in PHEV and BEV applications mainly depend on the power density (kW/kg) and energy density (Wh/kg) due to the design concept. However, the battery technology also should be able to have good performances in the terms of energy efficiency, lifetime, and charging rate [12-15]. In this section all these parameters have been analyzed for 10 lithium-ion battery types as presented in Table 1.
In [16] the main design concepts of PHEV applications are discussed, compared to the three sets of influential technical goals, and explained the trade-offs in PHEV battery design. They mentioned that the energy and power requirements according to the U.S. Advanced Battery Consortium (USABC) should be in the range of 82 Wh/kg and 830 W/kg for PHEV-10 and 140 Wh/kg and 320 W/kg for PHEV-40. Pesaran specified these two battery types as high power/energy ratio battery (PHEV-10) and low power/energy battery (PHEV-40). The first category PHEV-10 is set for a “crossover utility vehicle” weighing 1950 kg and PHEV-40 is set for a midsize sedan weighing 1600kg [16]. In this study, only the battery performance characteristics for PHEV-40 (40 miles All Electric Range) is investigated based on the USABC goals [16].
Figure 1 shows the results of the Dynamic Discharge Performance test (DDP) and the Extended Hybrid Pulse Power Characterization (HPPC) test [12,17-19]. As one can see, the energy density of nickel manganese cobalt oxide (LiNiCoMnO2) based battery types D&E is in the range of 126 – 149Wh/kg while the cells using iron phosphate in the positive electrode show energy density being in the range of 75 – 118Wh/kg. In [20], is reported that the high energy density values for the LiNiCoMnO2 batteries is mainly due to the higher nominal voltage (e.g. 3.7V) and good electrode specific capacities. However, the situation regarding the power density is not clear due the fact that power is varying over a wide range. Figure 1 shows that only cell type D using LiNiCoMnO2 has the highest power density around 2100Wh/kg. This result is mainly due to the good specific impedance [20].
The results indicate also that iron phosphate based battery types B and H have good power performances being in the range of 1580-1650 W/kg. However, based on the USABC goals, all the tested cells can meet the power requirements of 320W/kg with exception of battery F 290W/kg. Although the battery type E has the best energy density, the power capabilities of this battery are limited in comparison to the batteries types B, D and H, which indicates that this battery is more appropriate for BEV applications as reported in [12]. The presented results in Figure 1 are based on the maximum discharge C-rate at 50% state of charge.


Energy efficiency
In PHEV applications, energy efficiency during charge and discharge phases can be considered as one of the key factors. High-energy efficiency is desired to limit the temperature rise inside a battery pack. In this section, the energy efficiency of the proposed battery types has been considered based on the DDP test [19].
It is well pointed out in Figure 2, that the energy efficiency of the nickel manganese cobalt oxide based cells is around 94 – 96%. While the iron phosphate and nickel cobalt aluminum in the positive electrode show generally a lower efficiency in the range of 88 – 93%. The lower energy efficiency for lithium iron phosphate based batteries can be explained due to the relative lower conductivity of cathode material compared to NMC based batteries.

Charge performances
It is generally known that PHEV applications are an important factor for improving the impact of traffic on healthier living environment by emitting a lower amount of CO2 than the conventional vehicles. However, the advantages of PHEV applications mainly depend of the energy storage device. On the other hand, in order to enhance the suitability of the battery technology in PHEV applications, the battery requires besides good power, energy and energy efficiency performances also acceptable fast charging capabilities. In [21], it is well reported that the charging process of battery typically involves two phases:
- The main charging phase, where the bulk of energy is recharged into the battery (constant current),
- The final charge phase, where the battery is conditioned and balanced (constant voltage).
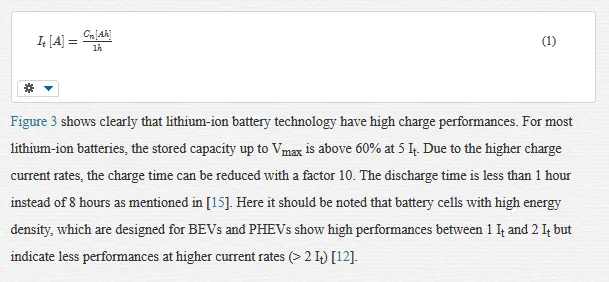
In this section, the fast charging performances of the different batteries until the main charging phase have been analyzed. In this study the main charging phase has been considered at different charge current rates (0.33 It, 1 It, 2 It and 5 It). The reference test current It can be expressed as according to the standard IEC 61434 [22]:

Thermal characterization
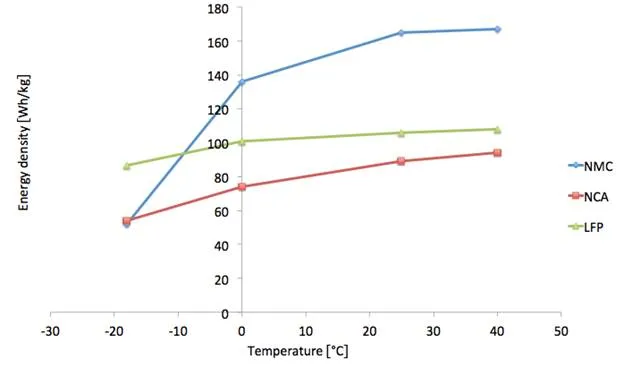
According to the United States Advanced Battery Consortium, the battery system in HEVs, PHEVs and BEVs should operate over a wide operating temperate (from -40°C until 60°C) In order to illustrate the battery behavior at different working temperatures, the same dynamic discharge performance test as described above has been performed at -18°C, 0°C, 25°C and 40°C as described in the standard ISO 12405-1/2 and IEC 62660-1 [23-25].
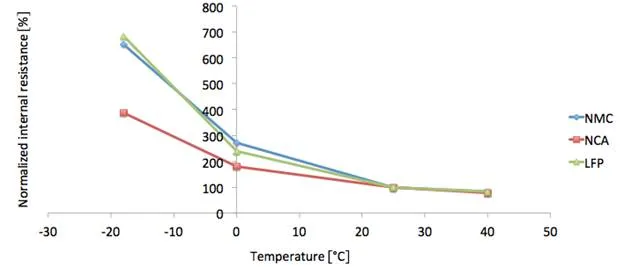
Figure 4 illustrates that the nickel manganese cobalt oxide based battery (type E) has an energy density of 150-125 Wh/kg in the temperature range of 40°C and 0°C. While the energy density of lithium iron phosphate (type H) and lithium nickel cobalt aluminum oxide in the positive electrode (type F) seem to have less favorable performances 108-101 Wh/kg for LFP and 94 74 Wh/kg, for NCA. However, the performances at -18°C are less beneficial for NMC battery type around 50 Wh/kg against 54 Wh/kg and 86 Wh/kg for NCA and LFP, respectively. These results show that the energy density reduction is 60% for NMC, 40% for NCA and 20% for LFP cells. This means that a heating system will be more than desired for NMC and NCA cells in order to keep the battery cells in the appropriate temperature envelope (40°C-0°C), where the energy performances are relative high. The high energy density in the case of NMC at 40°C and 25°C are due to the good specific capacity and the higher nominal voltage. The obtained energy density for nickel cobalt aluminum in the positive electrode is quite small against what is documented by Burke [9]. The reason is that the investigated cells (see Table 1) are dimensioned for hybrid applications rather than battery propelled electric vehicles. In [26] is reported that the limitation of the energy density at low temperatures is mostly related to the considerable increasing of the internal resistance. However, Figure 5 indicates that the aspect does not apply for LFP based battery. The normalized internal resistance increases in the case of the latter mentioned cell chemistry is 650% compared at the reference temperature (25°C). The internal resistance has been determined at 100% SoC and the applied current was 0.1 It and 1 It.
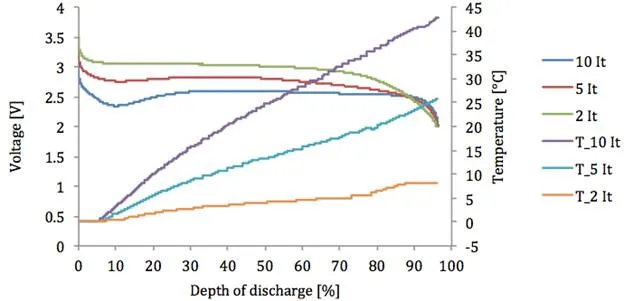
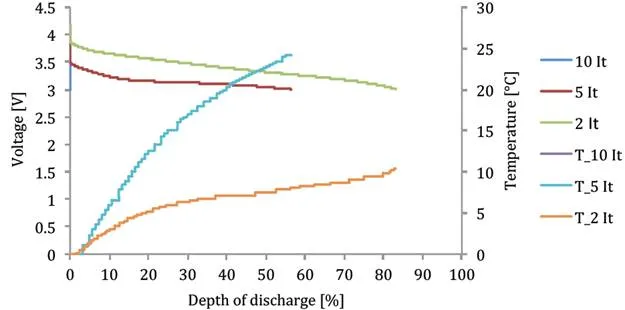
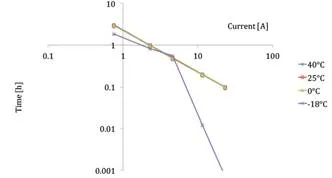
In order investigate the behavior of the proposed LFP and NMC based batteries in depth, a number of capacity tests have been carried out at current rates 2 It, 5 It and 10 It at 0°C. Figure 6 and Figure 7 show the favorable performances of the LFP chemistry against the NMC. Especially at 0°C, the LFP battery demonstrates the excellent performances due to the self-heating mechanism that occur at high current rates. In Figure 6, we observe that the voltage at 10 It drops fast but remains above the minimal voltage: 2V. Then, the voltage recovers when the battery temperature considerable increases (43°C) due to the higher internal resistance. The battery is able to attain almost the same discharge capacity as at lower current rate and high working temperature as it is illustrated in Figure 8. Here, we can notice that the Peukert number in the temperature range (0°C – 40°C) is close to one as is reported by Omar et al. [7]. However, at low temperatures (-18°C and forward) the Peukert number increases (1.85) due to the reducing of the discharge capacity, which is caused by the significantly high internal resistance. It should be pointed out that in the region 0.33 It and 2 It, the Peukert number is smaller than 1, which is in contradiction with the Peukert phenomena. The explanation of this behavior is due to the fact that the Peukert relationship has been extracted particularly for lead acid batteries and for relative low current rates and in operating temperatures, which is close to the room temperature. However, for lithium-ion batteries and mainly at low temperatures (-18°C), there are another complex phenomena that occur that only cannot be explained by Peukert.

Electrical and thermal modeling
In development of an appropriate battery pack system, the battery management system can be assumed as a key system [27]. The accuracy and the performances of this system depend on the developed balancing system and an accurate electrical and thermal battery model which can predict the battery cell behavior under all operational conditions. The electrical model is required for prediction of the battery behavior such as energy, power, internal resistance, life cycle and energy efficiency. On the other hand the thermal model is needed to predict the surface temperature of the battery cell for operating of the cooling and heating system when required. Further, the output of the thermal model will be used as an input for the electrical model due to the dependency of the model parameters as a function of the temperature. In this section the performances of the well-known first order FreedomCar battery model will be analyzed by using a dedicated test protocol and a new estimation technique. Then, the analysis is extended with a novel developed thermal model that has been developed at the Vrije Univeriteit Brussel for lithium-ion batteries.
Electrical model: FreedomCar battery model
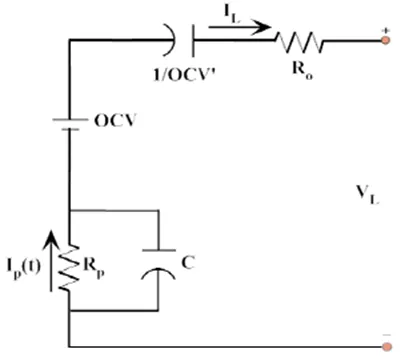
As reported above, the BMS requires an accurate electrical battery model for prediction of the battery behavior during the short and long term. Therefore, in the literature, one can find a number of electrical models such as Thévenin, FreedomCar, second order FreedomCar and RC battery model [28, 29]. The Thévenin battery model is a modified model of the FreedomCar battery model as it is presented in Figure 9. The Thévenin model is during steady state operations less accurate than the FreedomCar model due to the absent of the fictive capacitor 1/OCV’. The second order FreedomCar battery model has relatively higher performances than the Thévenin battery model, but this model is also more complicated due to the present of two RC-circuits in the system, which seems in the reality too heavy for BMS in PHEVs and BEVs where 100 battery cells are connected in series. Therefore, the processing unit should be very powerful.
In the framework of this section, only the characteristics of the first order FreedomCar battery model will be addressed and compared with experimental results. As it presented in Figure 9, the FreedomCar model exists mainly of an ohmic resistance (Ro), a fictive capacitor (1/OCV’) which represents the variation of the voltage over the time, an open circuit voltage OCV and a RC circuit existing of a polarization resistance Rp and capacitor C. The model assumes that the battery model parameters should be as function of state of charge and temperature. However, the researchers at the Vrije Universiteit Brussel found that the impact of the current rate and cycle life are also important parameters that cannot be avoided [28]. Then, the researchers found also that the ohmic resistance should be divided into two parts: the charge ohmic resistance and the discharge ohmic resistance due to the battery hysteresis [28]
Calibration and validation results
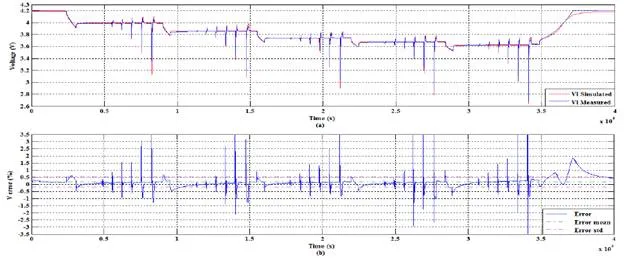
Prior starting with validation of the proposed battery model, the model has been calibrated by performing a new developed test profile at the Vrije Universitiet Brussel as it is presented in Figure 10. As we can observe, there is a good agreement between the simulation and the experimental results. According to these results, the error percentage is not higher than 3.5%. This indicates the powerful performances of the proposed battery model with the developed estimation technique.
Thermal model
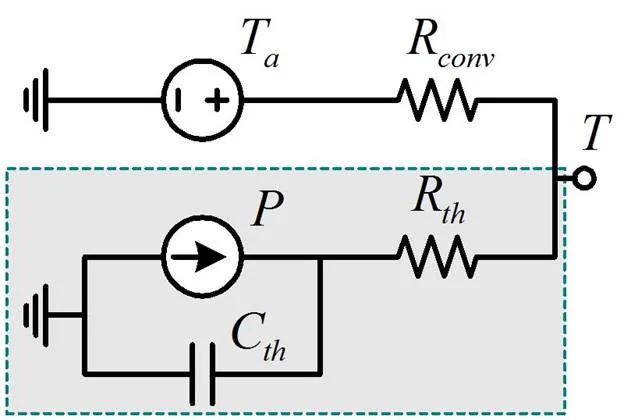
Regarding the prediction the thermal behavior of a battery, this can be performed by using high accurate thermal sensors or by dedicated thermal battery models. However, thermal models have many advantages against thermal sensors. The sensors can only measure one specific point. As it is generally know the heat distribution over the surface temperature of the battery is not uniform. In order to have a good sight of the heat development inside the battery, several thermal sensors are needed. This issue will complicate the BMS and the processing time of the BMS will be significantly longer. Therefore, it is more of high interest to issue thermal model which can predict the heat development and distribution over the battery surface. Further, such models allow in advance the battery pack designer to investigate the weakness in the battery pack and to dimension the cooling system more accurately. Finally, the development cost of such battery model is less than the cost of the significant higher number thermal sensors that are needed. In this perspective, a novel thermal model has been developed at the Vrije Universiteit Brussel that can be used for lithium-ion batteries and supercapacitors [30, 31]. In Figure 11 the thermal model is illustrated. As we can observe, the model exists of the following components [30, 31]:
- Pgen represents the heat generation (irreversible heat)
- Cth stands for the thermal capacitance,
- Rthi is the thermal resistance,
- Rcon represents the convection thermal resistance,
Calibration and validation results
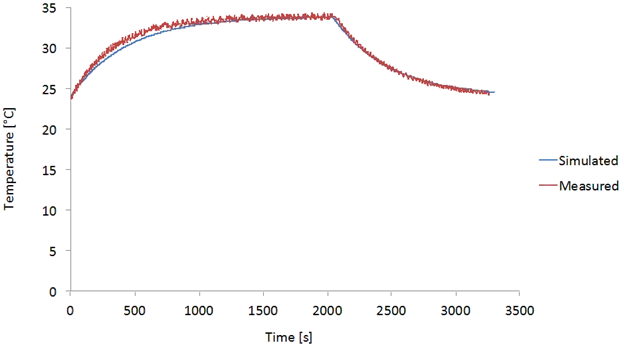
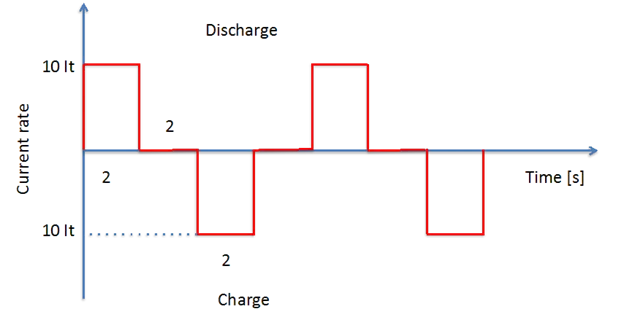
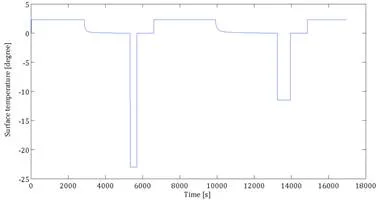
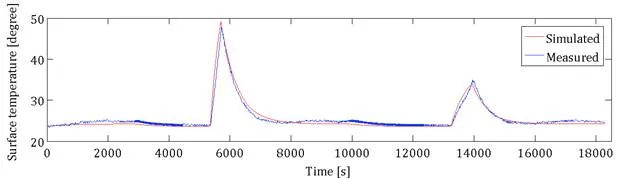
In order to verify the developed thermal battery model, series of comparisons are made based on simulation and experimental results. The first test is presented in Figure 12. As we observe, the model is in good agreement with experimental results. The errors percentage based on this test is in the range of 1°C. In this test, the model has been compared with experimental results based on the load profile as proposed in Figure 13 until the surface temperature has reached the steady stated condition.

However, there is a need for validation step to evaluate the performances and accuracy of the developed battery model at other conditions without to perform any calibration in the model. In Figure 14 a validation test has been carried out at room temperature about 24°C. The corresponding simulation and experimental comparison are illustrated in Figure 15. Here again, we recognize that the high accuracy of the battery model against the experimental results. Based on these results, we can conclude that the developed battery model is able to predict the surface temperature of the battery cell with significantly low errors.
Supercapacitors
Supercapacitors, also known as Electric Double-Layer Capacitors (EDLCs)or ultra capacitors, have a high energy density when compared to conventional capacitors, typically thousands of times greater than a high capacitance electrolytic capacitor. For example, a typical electrolytic capacitor will have a capacitance in the range of tens of milli-farads. The same size supercapacitor would have a capacitance of several farads. Larger supercapacitors have capacitance up to 5000 farads. The highest energy density in production is 30 Wh/kg. Although supercapacitors have very high power density and capacitance values of thousands of Farads are possible, the cell voltage is limited to about 2.7 V to avoid electrolysis of the electrolyte with the consequent emission of gas and deterioration of the supercapacitor cell. The structure of a basic cell is mostly cylindrical. However, there are also now commercial pouch supercapacitors available. The technology achievement is identical to that used for conventional capacitors. The supercapacitors cells used in this study are the BCAP310F and BCAP1500F. Their properties are based on the double layer capacitance at the interface between a solid conductor and an electrolyte. The elementary structure consists of two activated carbon electrodes and a separator impregnated with an electrolyte. The electrodes are made up of a metallic collector, coated on both side with an active material, which has a high surface area part which is required for the double layer. The two electrodes are separated by a membrane (separator), which prevents the electronic conduction by physical contact between the electrodes but allows the ionic conduction between them. This composite is subsequently rolled and placed into a cylindrical container. The system is impregnated with an organic electrolyte. The two electrodes are metalized and connected to the outside (+) and (-) terminal connections of the supercapacitor.
Electrical characterization
Equivalent series resistance and capacitance of supercapacitor calculation methods:
Using an Electrochemical Impedance Spectroscopy (EIS)
Electrochemical impedance spectroscopy (EIS) is used in the characterization of electrochemical behavior of energy storage devices. Impedance analysis of linear circuits is much easier than analysis of non-linear ones. Electrochemical cells are not linear. Doubling the voltage will not necessarily double the current. However, the electrochemical systems can be pseudo-linear. In normal EIS practice, a small (1 to 10 mV) AC signal is applied to the cell. With such a small potential signal, the system is pseudo-linear.
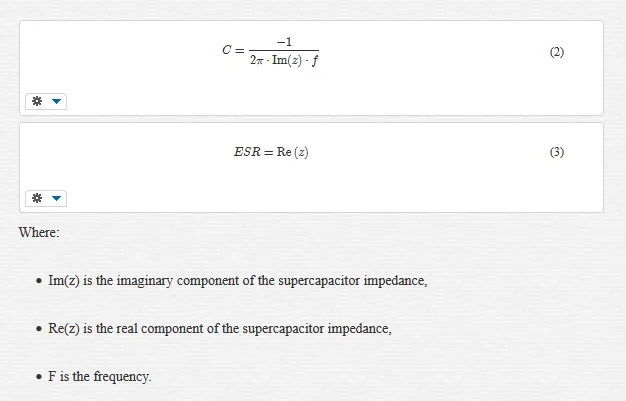
The supercapacitor is polarized with a dc voltage. A small voltage ripple, typically 10mV, is superimposed on the dc component. The ripple frequency is swept between 1 mHz and 1 kHz. The measurement of the current amplitude and phase with respect to the injected voltage permits the determination of the real and imaginary components of the impedance as a function of the frequency. The measurements were performed in a controlled climatic chamber. The supercapacitor capacitance C and the series resistance (ESR) are deduced from the experimental results, respectively.
The Maxwell BCAP310F and BCAP1500F supercapacitors used in this study are based on activated carbon technology and organic electrolyte. These devices were characterized using the Electrochemical Impedance Spectroscopy (EIS) [32].
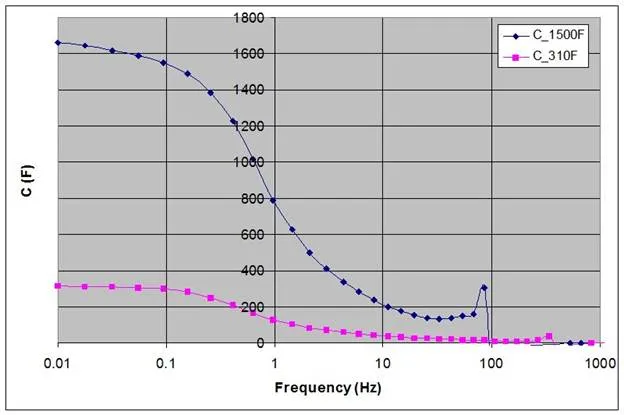
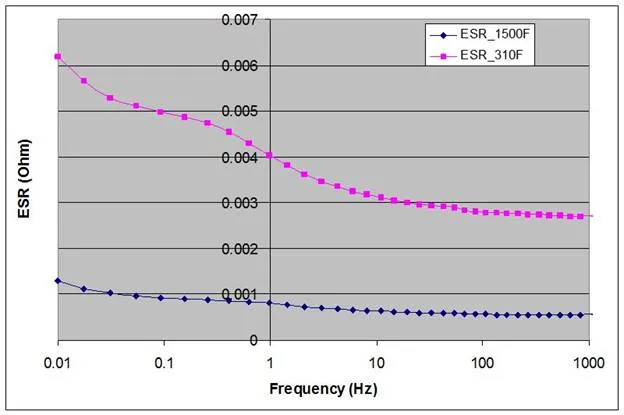
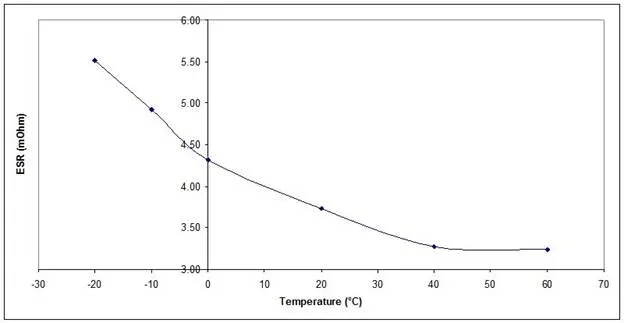
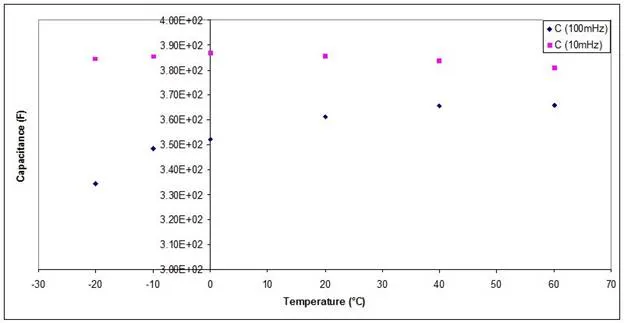
Figure 16 and Figure 17 represent the BCAP310F and the BCAP1500F capacitance and ESR as a function of frequency.
At low frequency, the capacitance is maximum, for example at 10mHz the capacitance value is in order of 1660F for the BCAP1500F and 315F for the BCAP310F. At 50mHz the ESR value is in order of 1mΩ for BCAP1500F and 5.2mΩ for BCAP310F. The BCAP310F ESR is relatively high because this device was fabricated, by Maxwell Technologies, especially for these thermal tests; it is including 4 thermocouples type K inside.

Based on the IEC 62576 standard
The standard IEC (International Electro-technical Commission) 62576 [33,34] defines the calculation methods of the equivalent series resistance and the capacitance of electric double-layers capacitors.
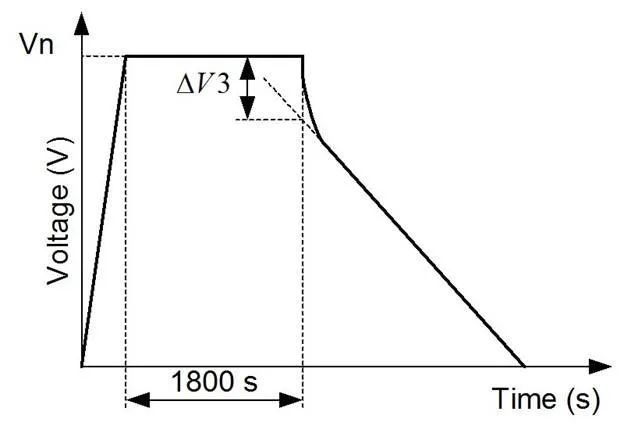
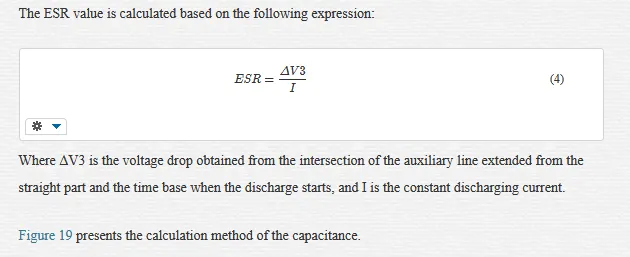
Figure 18 presents the calculation method of the equivalent series resistance. The supercapacitor is charged at constant current to its nominal voltage, this voltage should be maintained at this value during 30 min. Then, the supercapacitor is discharged at constant current up to 0V. The value of the constant current depends on the applications. The IEC 62576 suggests to choose 10xC, 4xCxUr, 40*C*Ur and 400xCxUr mA for the supercapacitors applied as memory backup (class 1), energy storage (class 2), power unit (class 3) and instantaneous power unit (class 4), respectively [33,34]. Where, C is the capacitance and Ur represents the rated voltage
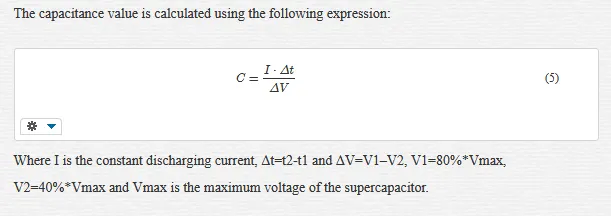
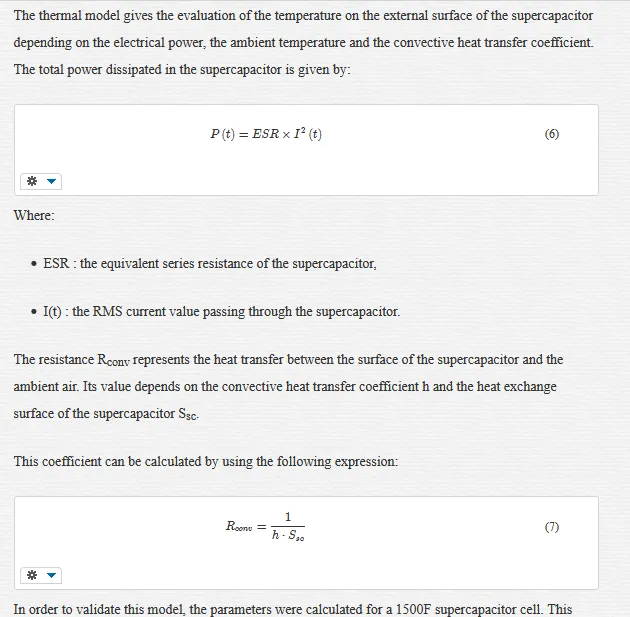
The BCAP1500F capacitance and ESR were calculated according to the IEC 62576 standard. The supercapacitor is discharged at constant current 100mA/F. Figure 20 represents the BCAP1500F voltage and current versus time during the discharge. ESR and C are 1.07mΩ and 1525F, respectively.
Thermal characterization
Heat production in supercapacitor is related exclusively to Joule losses. The supercapacitors support currents up to 400A or more depending on cell capacitance and used technology. The repetitive charge and discharge cycles of the supercapacitor cause a significant warming even though the equivalent series resistance value is around the mΩ according to the capacitance. Several authors showed that the supercapacitor ESR varies according to the temperature [35-37]. In [38] the authors have studied the effect of the temperature and the voltage on the supercapacitors ageing. They have established a model which allows analyzing self-accelerating degradation effects caused by elevated voltages and temperatures, this model is a holistic simulation model that combines electrical and thermal simulation of supercapacitor modules with an ageing model.
In the reference [39] the authors have studied and modeled the temperature effect on the supercapacitor self discharge.
This rise in temperature can have the following consequences:
- The deterioration of the supercapacitor characteristics, especially ESR, self discharge and lifetime [39,40], which affect its reliability and its electrical performance.
- The pressure inside the supercapacitor is increased.
- A premature aging of metal contacts, in fact the repetitive heating and significant temperatures can deteriorate rapidly the terminal connections of the supercapacitor.
- The evaporation of the electrolyte and hence the destruction of the supercapacitor if the temperature exceeds 81.6°C which is the boiling point of the electrolyte.
Therefore, it is important to know and understand the heat behavior of supercapacitor cells and modules. This leads to an estimation of the space-time evolution of the temperature.
This study deals with the thermal modeling and heat management of supercapacitor modules for vehicular applications. The thermal model developed is based on thermal-electric analogy and allows the determination of supercapacitor temperature. Relying on this model, heat management in supercapacitor modules was studied for vehicle applications. Thus, the modules were submitted to real life driving cycles and the evolution of temperatures of supercapacitors was estimated according to electrical demands. The simulation results show that the hotspot is located in the middle of supercapacitors module and that a forced airflow cooling system is necessary.
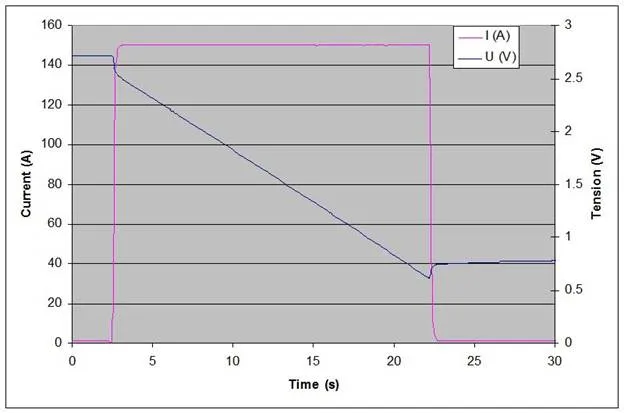
For supercapacitor thermal behavior, the device was characterized by using the EIS for different temperature. Figure 21 presents the Maxwell BCAP0310F ESR variations according to the temperature. The ESR increases at negative temperature values. The ESR variation is higher for negative temperature than for positive one. This is due to the fact that the electrolyte’s conductivity is strongly temperature dependent. Above 0°C ESR varies slowly with the temperature. Below 0°C the temperature dependency is stronger. Higher ESR is due to the increase of the electrolyte’s viscosity at low temperatures limiting ionic transport speed which increases the resistance of the electrolyte.
Electrical modeling
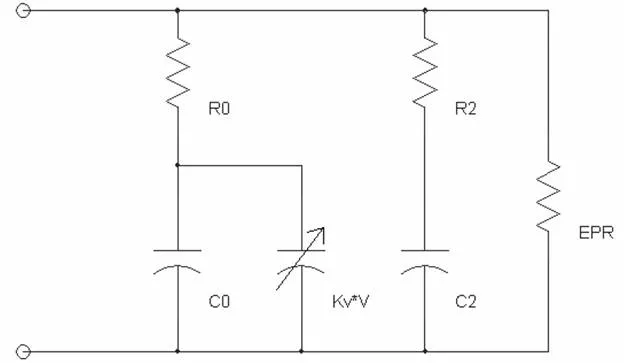
In literature, several supercapacitors have been developed for different purposes [47-51]. In [47], a model has been proposed by Faranda et al (see Figure 23). The model exists of three branches. The first branch containing R0 represents the fast response of the supercapacitor in term of few seconds. The second branch contains a resistance and a large capacitor. Then the second branch demonstrates the long-term behavior in term of few minutes. However, the analysis that has been carried out by Chalmers University showed that the error between the simulated and experimental results for such model is in the range of 10%, which is statistically high.
In [48] a second order model has been proposed to demonstrate the supercapacitors behavior. The proposed model is strong similar to the second order Thévenin battery model. The model has significantly higher accuracy (error between the simulated and experimental results <5%) than the previous supercapacitor model due to the non-linear behavior of the model.
In [49-51] a new model has been developed based on electrochemical characterization of the supercapacitors on electrode and electrolyte level. Therefore, the model as presented in Figure 24 below has been proposed.
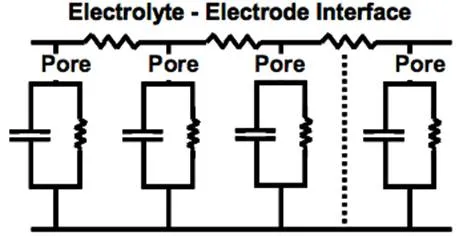
Here it should be underlined that this model needs dedicated test procedures for determining the model parameters, which only can be carried out by chemists. Therefore, the use of the model in the vehicular applications is useless.
Then for the first two models, the model parameters can be extracted from the electrical approach. However, the simulation time and the complexity of such models is an obstacle in HEV applications. Therefore, in this section the model as presented in Figure 25 seems the most interesting model in real applications.

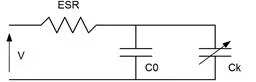
A supercapacitor cell can be modeled by an equivalent RCC circuit as shown in Figure 25, where ESR is the series equivalent resistance, C0 is a constant capacitor and Ck=k*V varies according to the supercapacitor voltage. These parameters are identified by charging and discharging at constant current [40-46] and the obtained values for the BCAP310F were ESR=4.25mΩ, C0 = 282 F and Ck=46*V. This model is suitable for applications where the energy stored in the capacitor is of primary importance and the transient response can be neglected.
Thermal modeling
The thermal model developed is based on thermal-electric analogy and allows the determination of supercapacitor temperature inside and at the surface. The developed model can be easily implemented in different simulation programs. It can be used in the modeling of supercapacitors in order to study the heat management of a supercapacitors module. This model makes it possible to size the supercapacitors module cooling system when necessary. This is in order to maintain the temperature of the module within the operating temperature range given by the manufacturer. A Matlab/Simulink® simulation model was developed in order to calculate the Rth and Cth of a supercapacitor cell. Calculated values were compared to experimental values and the simulation model was validated. Thus a supercapacitor can be modeled as succession of RC and current source circuits. This application permits to calculate the evolution of the temperature in each layer of the supercapacitor cell. It can be used to perform detailed analysis of the temperature variation within a supercapacitor. When using supercapacitor modules which are composed of several cells in series and /or in parallel, it is necessary to study the thermal management of these modules [31]. The aim is to calculate and locate the maximum temperature in order to size the cooling system if needed. In this case, to reduce simulation time, the thermal model can be simplified as shown in Figure 26.
Results presented in Figure 28 show a good correlation between the experimental and simulation. Good agreements were also obtained with 10A and 20A constant currents for charging and discharging cycles.
Conclusion
In this chapter, the performance and characteristics of various lithium-ion based batteries are evaluated and discussed taking into account the power and energy densities, the capacity and the current rates. The evaluation is mainly based on the electrical and the thermal behavior. Different types of batteries were characterized at different current rates and different temperatures. The Peukert relationship was evaluated in function of various operating conditions. Electrical and thermal models are developed and presented. The battery electrical model is based on the first order FreedomCar model. The parameters of the electrical model were obtained and calibrated based on a new developed test profile. A battery thermal model is proposed, discussed and validated. Electrical and thermal characterizations of supercapacitors were studied. The different basic calculation methods based on the EIS and the IEC 62576 of the Equivalent Series Resistance (ESR) and the capacitance of a supercapacitor are presented. An electrical model of the supercapacitor based on RCC circuit is presented. A thermal model of the supercapacitor is presented and it is based on the thermal-electric analogy. The model was validated using experimental results of the BCAP1500F supercapacitor cell. The simulation results of the thermal model can be used to find out if a cooling/heating system is necessary for the use of supercapacitor in order to improve its efficiency. The models developed are simple enough to be implemented in different simulation programs and thermal management systems for hybrid electric vehicles.