Energy availability and cost is at the heart of today’s political and scientific agenda involving many economic, ecologic and geopolitical aspects. For instance, the European Council has established the objectives of reducing greenhouse gas emissions by 20%, of increasing the share of renewable energy to 20% and of improving energy efficiency by 20% by 2020 [1]. On March 2011, the European Commission adopted its new White Paper on Transport policy with a roadmap of 40 initiatives for the next decade to reduce Europe’s dependence on imported oil and decrease the carbon emissions in transport by 60% by 2050, and in December 2011, has communicated the Energy Roadmap 2050 to pave the way to those objectives.
According to the New Policies Scenario, the central scenario of World Energy Outlook 2011 which supposes if recent government policies on energy and climate change are implemented in a cautious manner, the International Energy Agency, IEA, forecasts that the world primary demand for energy will increase by one-third between 2010 and 2035 [2]. The world Total Primary Energy Supply, TPES (with nearly 87 % coming from fossil fuels in 2009 [3]), has to fulfill this Demand. It should be noted that in 2009, around 31 % of the TPES was spent on energy transformation, leaving only about 69 % of TPES for Consumption.
The Total Final Consumption of energy, TFC, in the modern world is also mainly in the form of fossil fuels and according to the IEA, oil will remain the single largest fuel in the fuel shares of total final consumption (43.4 % in 2005, 41.3 % in 2009) with transport and power generation sectors absorbing a growing part of global energy. Indeed, the transports sector alone was responsible for 60.3% of the World Oil Consumption in 2005, 60.5 % in 2006, 61.4% in 2008, and 61.74% in 2009, against 45.4% in 1973 [3] [4]. This increasingly fuel consumption and the existent or latent conflicts mainly in the Middle East lead to oil shortage fear and price rise [5, 6], confirmed by the July 2008 crude oil peak prices, around US$150. Besides the price problem, there are also very important energy dependence and security concerns as the crude oil come mainly from Middle East unstable countries [3]. Indeed, even if the past 2008 economic crisis with the resulting consumption decline, led to a decrease in crude prices, the development and mobility levels sought and somehow already felt by many developing countries, namely the Big Emerging Market (BEM) economies, in particular China and India, will put a long term increasing pressure on the oil consumption, availability and prices [2-4]. We might very likely be already entering “the last trillion barrels of oil”, as Non-OPEC oil production might have already peaked, and OPEC production could follow around 2020 [6].
Another issue is that the mass utilization of Internal Combustion Engine (ICE) vehicles in the transportation sector also increases pollution emissions, especially Greenhouse Gas emissions, which must be prevented for the sustainability of the planet and for life quality. The emissions of ICE vehicles are also one of the major sources of urban pollution, especially in medium-size and large cities. The high incidence of respiratory problems, allergies, asthmas, and some cancers is an increasing problem leading to public health concerns, as air pollution contributes definitively to mortality and morbidity. A study conducted in Austria, France, and Switzerland estimated the impact of outdoor (total) and traffic-related air pollution on public health [7]. It concluded that air pollution caused 6% of total mortality or more than 40000 attributable cases per year. About half of all mortality caused by air pollution was attributed to motorized traffic, accounting also for: more than 25 000 new cases of chronic bronchitis (adults); more than 290 000 episodes of bronchitis (children); more than 0.5 million asthma attacks; and more than 16 million person-days of restricted activities. Living in a polluted environment will undoubtedly lead to a lifetime decrease [8]. However, even living in a usually non polluted environment, a pollution peak can cause an “unexpected” increase in deaths and illnesses, like the ones in Europe during summer 2003.
Perspectives for sustainable transportation solutions
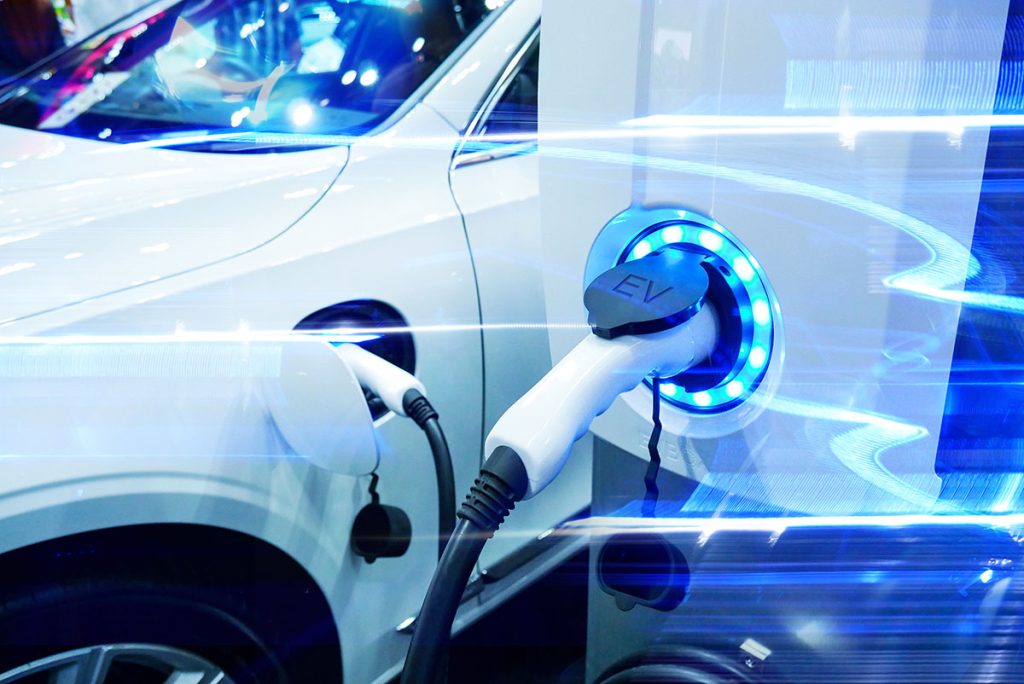
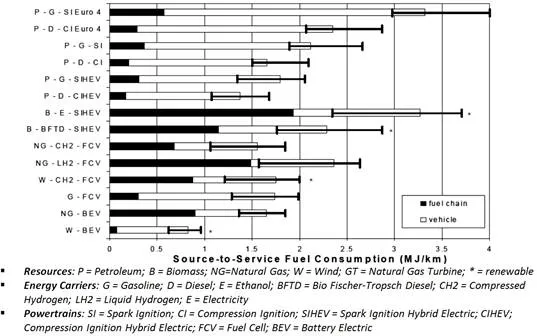
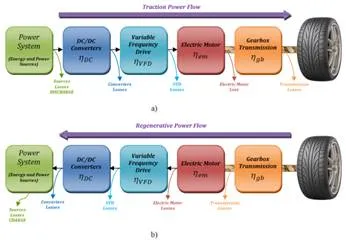
Due to the prior mentioned issues, there is now a general public awareness for the need for more economic, ecological and efficient transportation, namely electric vehicles (EVs) and hybrid electric vehicles (HEVs). Indeed, electric traction is the key to advanced and sustainable transports as the electric motor (EM) is much more efficient (typically with 70-90 % efficiency) than the ICE (10-30 %). This allows a much smaller in vehicle (or Tank-To-Wheel) energy consumption in vehicles driven by EMs comparatively to ICE vehicles (Fig 1, [9]), even with those complying with Euro 5 requirements, and makes the HEVs more energy efficient and cleaner (Fig. 2) than the ICE vehicles using the same engine technology. The Diesel HEVs promise to be a very effective option.
Here it should be pointed out that even though biomass fuels have much smaller Greenhouse Gas (GHG) emissions than fossil fuels (Fig. 2) its Source-to-Service fuel consumption is very high (Fig. 1). This should preclude the farmed biomass large scale utilization, contrarily to the news and hopes that have come to public mainly in 2006 and 2007, but had already lead to serious food price problems in 2008 due to the food-for-fuel dilemma: to use land to produce biomass for fuel instead of for food.
The problem here is that the efficiency of photosynthesis is only about 0.40% [10], which is extremely low. Taking into account the other losses in the fuel chain, the net energy available for electricity production or transportation utilization is even much smaller. For electricity it would be much better to use photovoltaic panels (PV): considering a 80% land use, a 12% efficiency in the DC generation from PV array, and 85% for the DC/AC conversion and transmission, the overall efficiency for photovoltaics is 8.16%, much higher than the overall efficiency of 0.137% obtained using bio-methane or the 0.074% from bio-hydrogen [10]. Concerning the energy harvest for transportation, the distance that can be driven with the annual energy extracted from one hectare of land is nearly 21500 km for Biodiesel, 22500 km for Bioethanol, and 3250000 km with Electricity from PV (151 and 144 times more, respectively). So, the problem is not the substitution of gasoline by biofuels but the replacement of inefficient ICE by efficient electric motors. [10]
Furthermore, while being basically non pollutant during its lifetime (considering proper battery recycling) and highly efficient, EVs are silent and gentle to drive.
Particularly, battery electric vehicles (BEVs) present zero emission of pollutants locally, which is very important for urban driving. If batteries are recharged using electricity from some renewable sources, namely wind (Fig. 1 and Fig. 2) or PV, then the differences, relative to ICE cars, increase and all the potential of the BEVs is shown. For these reasons, it is the authors’ belief that the future of Sustainable Mobility passes surely by the BEVs supplied from wind, hydro and PV, or other high efficient and clean renewable energy sources.
It should also be noted that as nowadays only a small percentage of the world electricity is produced from oil (5.8% in 2006, decreasing to 5.1% in 2009 [3]), there is another advantage in shifting the share of transports primary energy from oil to electricity, especially if the electric energy storage devices are charged during the night, using the energy surplus usually available in the grid and that can be increased by fostering the public lightning efficiency.
By all that has been presented, at the moment, the future perspectives for Sustainable Transportation Solutions seem to be [10]-[12]:
· Efficient electric or hybrid-electric cars for commuting and local transport (“Wind-to-Wheel” efficiency up to 70%);
· Avoidance of hydrogen for ICE and fuel cell vehicles (“Wind-to-Wheel” efficiency of 20% to 25%);
· Distant land, air and ocean transport with oil or biofuels.
A transition step while looking forward to the ideal solution of Zero Emissions Vehicles, are the Low Emissions Vehicles, as the HEV, specially the Plug-In Hybrid Electric Vehicles, PHEV. Several projects and models of EV, HEV and PHEV, including buses, vans and cars, have been developed in the last few years, resulting in cleaner, more economic and less noisy vehicles, some of them already available commercially. [13][14]
However, some incentives are still needed to allow electric vehicle (EV) technologies to develop and become more competitive.
Energy storage in electric vehicles
THE ENERGY STORAGE ISSUE IN ELECTRIC VEHICLES
To allow EVs to become the effective sustainable transportation solution, a great effort has to be done in R&D to overcome the major technical issue in EVs: the energy storage.
Typically, EVs store energy in batteries (usually Lead-Acid, NiMH and, more recently, Li-Ion) that are bulky, heavy and expensive. The specific energy of gasoline is about 12500 Wh/kg (of which only 2000-3000 can be considered useful energy, due to the very low efficiency of ICE) against typically 40-50 Wh/kg in good lead-acid batteries or 70 Wh/kg in NiMH, which gives an idea of the volume and weight necessary to store the energy needed to do the same work. Li-ion batteries have higher specific energy, around 150 Wh/kg but they are still expensive and some particular Li-ion technologies have safety issues that have to be carefully addressed. Due to these problems, with current battery technologies it is very difficult to make a general purpose EV that effectively competes with ICE cars. For massive deployment of EV, its driving range problem must be solved. [15]-[17]
MAIN AVAILABLE ENERGY SOURCES
At present and in the foreseeable future, the viable EVs energy sources are batteries, fuel cells, SuperCapacitors (SCs) and ultrahigh-speed flywheels.
Batteries are the most mature source for EV application. But they offer either high specific energy (HSE) or (relatively) high specific power (HSP). Fuel cells are comparatively less mature and expensive for EV application. They can offer exceptionally HSE, but with very low specific power. In spite of some quite expensive prototypes, such low specific power poses serious problems in their application to EVs that desire a high acceleration rate or high hill climbing capability. Also, they are incapable of accepting the high peaks of regenerative energy during EV braking or downhill driving. SCs have low specific energy for standalone application. However, they can offer exceptionally HSP (with low specific energy). Flywheels are still technologically immature for EV application. [18]-[20]
Some recent information on the energy sources can be found for example in [17], [21], [22].
MULTIPLE ENERGY SOURCES HYBRIDIZATION
For the “full electric” EV the solutions pass by significant progresses in battery technology and by using different energy sources with optimized management of the energy flow as none of the available energy sources can easily fulfill alone all the demand of EVs to enable them to compete with gasoline powered vehicles. In essence, these energy sources have a common problem: they have either HSE or HSP, but not both. A HSE energy source is favorable for long driving range, whereas a HSP energy source is desirable for high acceleration rate and high hill climbing capability. The concept of using and coordinating multiple energy sources to power the EV is typically denominated hybridization. Hence, the specific advantages of the various EV energy sources can be fully utilized, leading to optimized energy economy while satisfying the expected driving range and maintaining other EV performances. [22]-[25]
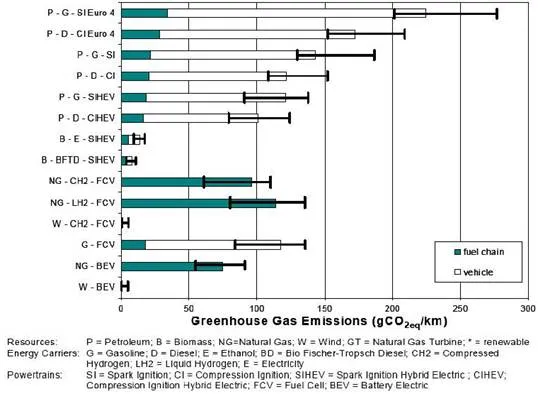
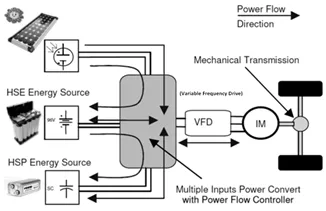
The basic operation of the hybridized system is shown in Fig. 3. In operations that require high power, as is required during a hard acceleration or traveling up slopes, the two energy sources provide power to the powertrain system, as shown in Fig. 3 a).
Moreover, in operations that require less power, for example, during travel at constant speed (cruising), the source with characteristics of high specific energy provides power to the drive system while simultaneously recharges the second source that only has characteristics of high specific power, as shown in Fig. 3 b), to prepare it for new high power demand situations. In braking and deceleration mode, the regenerative energy will essentially be stored in the source with high specific power characteristics, particularly the peaks and only a small, limited to its maximum power value, is absorbed by the source with high specific energy (see Fig. 3 c)). Thus, to try feeding an EV with only one of these sources with the same responsiveness as the one described above, the volume, weight and cost of the unique source would be so large that the system would be incapable of operating properly.
Therefore, the hybridization concept presents a scale economy using complementary feeding systems fusing the sources’ advantages and better responds to the drive requests. For this purpose, any work related to the hybridization concept of EVs should start with an optimized sizing of the on-board vehicle energy sources, meeting the minimum characteristic requirements aimed for the EV.
As mentioned in Section 3.2, with the current state of technological development, the future of EVs seems to go through the hybridization of various energy sources. This strategy seeks to benefit from the best qualities of each available energy source and is especially useful in urban driving. In [23], a methodology to optimize the sizing of the energy sources for an electric vehicle prototype, using different driving cycles, maximum speed, a specified acceleration, energy regeneration and gradeability requests is presented. The possibility of using a backup system based on solar energy is also studied, which may be considered in the design or as an extra to cope with unforeseen routines and to minimize the recharge of energy sources.
GENERATED, STORED, DEMANDED AND AVAILABLE ENERGIES
The total energy generated or stored (Wge.st) and demanded (Wdem) over a time period can be written in terms of the generated solar, regenerative break and storage powers and the power demand as follows:
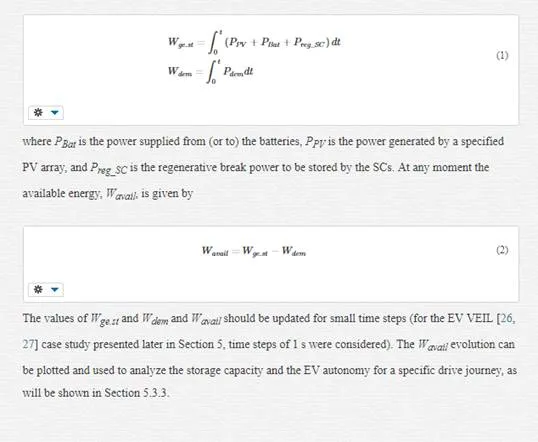
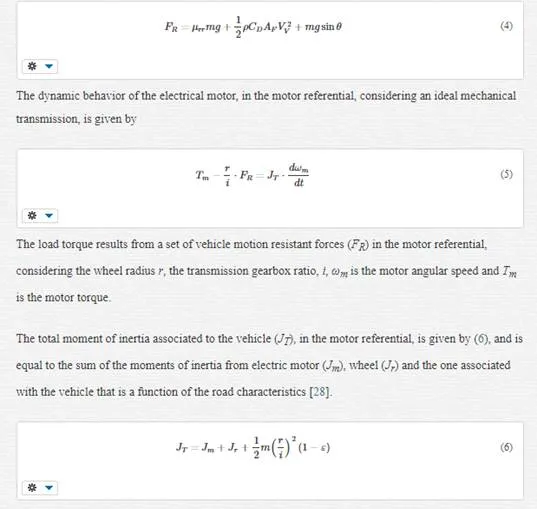
The aerodynamic drag force is given by the second term on the right side of equation (4), where the symbol ρ represents the air density, CD the drag coefficient, AF the frontal projection area and VV the vehicle speed relative to the wind [28]. It must also be noted that air density is variable, as a function of the atmospheric pressure, temperature and hygrometric conditions, and that the aerodynamic drag is proportional to the square of vehicle velocity. Thus the power applied to the motor, necessary to overcome FR, increases with the cube of the speed.
The weight component of the vehicle relative to the rolling plane angle, expressed in the last term of (4), corresponds to a force that opposes the motion when climbing, and is a function of the climbing angle θ and the vehicle mass m.
Case study
HYBRIDIZATION PROJECT FOR VEIL PROTOTYPE
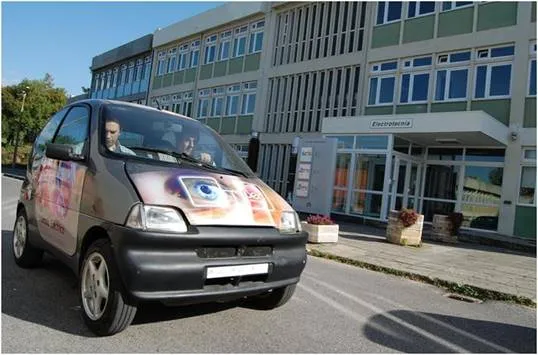
As previously described, the utilization of multiple energy sources is a well suited solution to overcome current EV barriers. To study the utilization of multiple energy sources in electric vehicles a small electric vehicle is used: at the Electrical Engineering Department of the Engineering Institute of Coimbra (DEE-ISEC), the authors’ team started the on-going VEIL project to convert a small Ligier 162 GL, initially with an internal-combustion engine (ICE), into an electric vehicle (Fig. 5) [26] [27
For the VEIL project prototype, the hybridization of three energy sources was considered to be viable: a HSE storage system – Batteries –, a HSP system – SCs – and photovoltaic panels, PV. Fig. 6 shows this hybridization configuration.
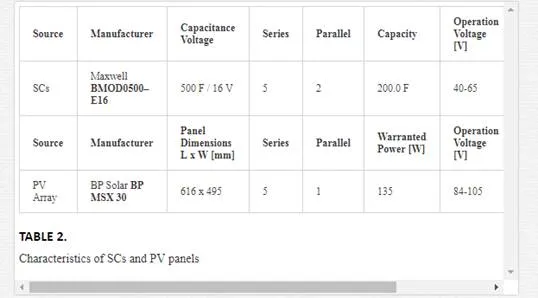
Considering the available space, 1300×1100 mm on the rooftop, and 550×1100 mm over the hood, it is possible to implant 5 selected PVs (cf. Table 2), 4 on the rooftop and 1 on the hood.
TEST CYCLES, SCENARIOS AND SOURCES
In this work, three different scenarios have been used to study the utilization of different combinations of energy sources, corresponding to typical possible utilizations of a small electric vehicle and in particular of the VEIL [35]. In the three scenarios three different time periods were considered: a first displacement in the morning, starting at 7:30 and taking 1.5 h (to get to work, for instance), a second period where the car is parked outdoor and lasting 8 h, and a third period equal to the first one, corresponding to the return back home, from 17:00 to 18:30.
The first scenario, Scenario 1, corresponds to a typical routine for mobility in big European cities with low average speed and very frequent stops and goes. To simulate this behavior the ECE 15 cycle presented in Fig. 7 a) was used. The travel in the morning consists of a sequence of 27 ECE 15 cycles, corresponding to nearly 27.35 km. The same distance has to be travelled in the evening to make the way back. Scenario 1 consists then of 27 ECE 15 cycles during 1.5 h, followed by a period of 8 h parked outdoor, and then again 27 ECE cycles. The total journey distance is 54.7 km (2 times 27.35 km).
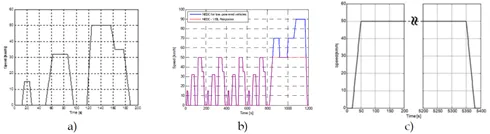
The second scenario, Scenario 2, corresponds to a mix use of urban and sub-urban/extra urban driving. It uses the New European Driving Cycle (NEDC), represented in Fig. 7 b), which consists of the combination of 4 ECE 15 cycles, repeated without interruption, followed by one EUDC cycle, which is limited to 90 km/h for low-powered vehicles. For the VEIL, which by law is limited to 45 km/h (free driving license car), the maximum vehicle speed was considered as 50km/h on the flat road. To fulfill the 1.5 h travel in the morning and in the evening, Scenario 2 uses 4.5 NEDCs totalizing 40.24 km followed by 8 h parked and again 4.5 NEDCs. The total journey distance is about 80.48 km.
Scenario 3 corresponds to an extra urban utilization at the VEIL full speed that for this kind of vehicle is limited to 45 km/h. Nevertheless, the study was done considering the slightly higher speed of 50 km/h, as in Fig. 7 c). In this case, 1.5 h is able to cover a 73.59 km distance between home and work in the morning and the same distance in the evening, to return back home (almost 149.18 km, in total).
For the considered test cycles, the request initial-acceleration performances are defined as accelerating the EV from standstill to 15km/h in 4s, to 32km/h in 22s and 50km/h in 8s, for the ECE 15 cycle, and from standstill to 50km/h in 14s, for NEDC cycle. The most demanding situation considered is then the 3rd period of acceleration in the ECE-15 cycle, where it is necessary to reach 50 km/h in 8s.
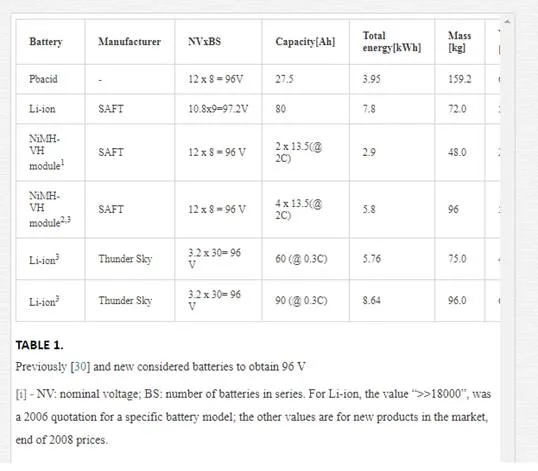
For the sources, several different types of batteries were considered with the main characteristics shown in Table 1, and SCs and PV panels with the characteristics shown in Table 2. The presented prices in Tables 1 and 2 are only indicative, as they correspond to the market prices obtained for the project quantities. They might decrease significantly for big quantities.
CALCULATION AND RESULTS
Using the previously presented formulation, several relevant quantities can be calculated. To implement the model, Matlab/Simulink® was used [36] and the characteristics of the electrical drive, the transmission ratio of the gearbox (i = 10), the wheel radius (r = 26 cm), the load vehicle mass (m = 500 kg), the air density (ρ=1.204 kg/m3 @ 20ºC), the drag coefficient (CD=0.51), the frontal projection area (AF=2.4 m2), the coefficient of rolling resistance (μrr =0.015), and the total moment of inertia associated to the vehicle (JT=0.53 kg/m2) were taken into account. The slipping of the wheels, for the control purposes, is not considered.
POWER ON THE WHEELS AND POWER IN THE SOURCES
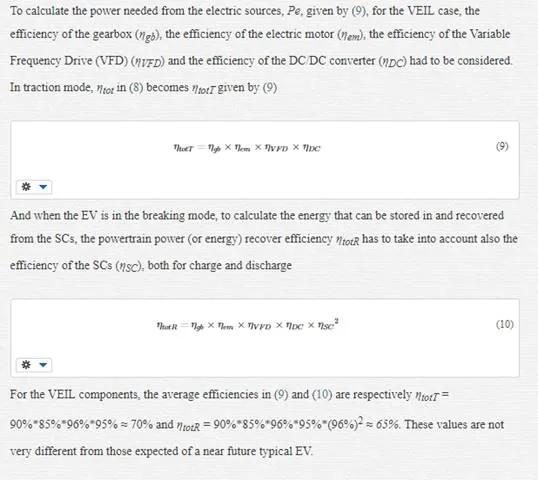
This clearly shows the need to carefully choose the components, as all the energy chain efficiency is strongly influenced by the less efficient component. For example, in Fig. 9 for the cycle ECE-15, the mechanical power needed on the wheels (“Power Demand”, Pu), given by (7), the electric power to be supplied by the electric sources (“Electric Power Demand”, Pe), given by (8) and also the “Total Regenerative Power” available on the wheels and the power that for the present case study can be recovered from the SCs, the “Effective Regenerative Power” (about 65% of the Total Regenerative Power available on the wheels), is presented.
It is also important to notice that, even though there are not experimental results for all the cases considered, the simulated results for the electric power demand at 50 km/h constant speed (zoom on Fig. 9), 4.5 kW, are in very good accordance with the measured ones, 4.3 kW [27], which validates the model used, for a high level daily energy study. Nevertheless, it should also be pointed out that to study the system response, a much more detailed study has to be performed with more accurate component models and smaller time step scales [38], and to manage the energy sources, a real time multiple energy source monitoring system has to be used [39].
STUDY OF THE EFFICIENCY POWERTRAIN INFLUENCE
Using the presented formulation with the different electrical energy source combinations of PV array, SC and Batteries, and the different scenarios for typical drive journeys, as explained in Section 6, the available energy, Wavail, was calculated with (2) for 1 s steps for a typical 24 h period. As initial conditions, the batteries were considered fully charged and the SCs completely discharged.
For the solar energy, the average hourly statistics for direct normal solar radiation [Wh/m²] for the last 30 years at the project location, Coimbra, was used. The PV array efficiency model was used to compute the global generated energy by the panels on a typical day of two different months, November and August, with the minimum and maximum solar radiation, respectively. To account for the near horizontal position of the PV panels, as well as for some undesirable aspects like the different solar panels orientation (giving origin to non-uniform irradiation), and the effects of the buildings and trees shadows, a depreciation of 25% on the normal irradiation was considered. When the car is moving, the PV energy can be directly used by the powertrain, decreasing the amount of energy supplied by the batteries. When the car is parked, the PV energy is stored in the batteries. As the charge current, around 1 A, is much smaller than any of the considered batteries typical charge currents, the batteries’ losses were neglected. The expected accumulated energy varies between 900 Wh and 1350 Wh a day, depending on the considered month, and supposing that the driver can find a sunny and good oriented parking place.
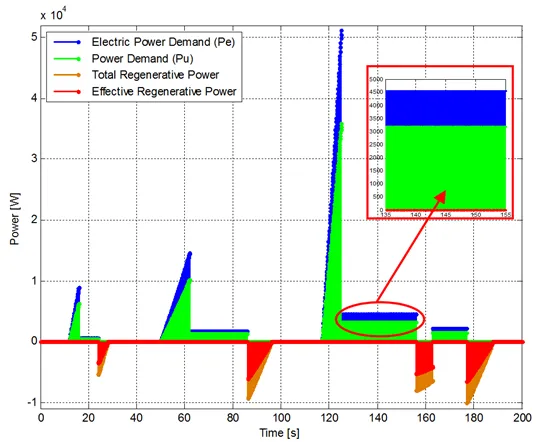
In Fig. 10 the results for Case A and Case C are compared for scenario 1 (2x27xECE 15 cycles) and with or without considering the efficiency of the components on the power/energy chain. From the energy management and sources comparison points of view sometimes it is only considered the energy at the wheels [30]-[33]. However, as can be seen from these two graphs, for the sources or autonomy sizing it is fundamental to consider the energy efficiency of all the energy chain. For example, from Fig. 10a) it could be said that using only the NiMH batteries and SCs the travel of work-return home could be accomplished (curve 1, with a slightly positive value at the end of the journey) but considering the ηtot it can be seen that it is not possible in any case, not even with the help of the PV panels (curve 2). Comparing curves 1 and 3, it can also be seen that the influence of the regenerative breaking energy is much smaller (only nearly 65% – ηtotR – reach and can be extracted from the SCs, and only 70% – ηtotT– of this energy return back to the wheels, which gives an overall recovery of 45.5%, from wheel-to-wheel for the present EV components).
STUDY OF POSSIBLE SUITABLE SOLUTIONS FOR THE AUTONOMY OBJECTIVES: 4 NIMH BANKS (CASE D) VS NEW LI-ION BATTERIES (CASES E&F)
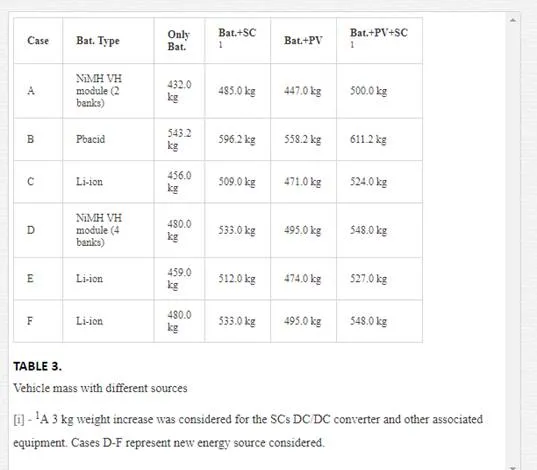
To study possible suitable solutions for the autonomy objectives, three new solutions were considered: Case D, where the duplication of the present two NiMH battery banks to four banks was considered, and Case E and F, using Li-ion batteries that more recently appeared in the market. The relevant quantities were calculated for all the six cases in Table 3 for each one of the three considered displacement scenarios, and with and without considering the components efficiency.
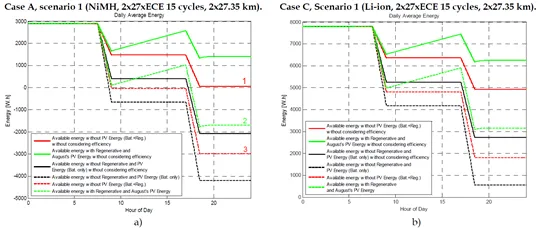
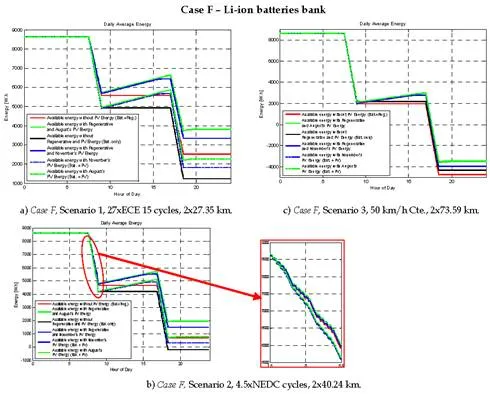
The Wavail evolution considering ηtot (ηtotT and, when applicable, ηtotR), is presented in Fig. 11 and 12, for Case D and Case F, respectively. These figures contain a lot of information from where some important conclusions could be extracted. Some of them will now be presented.
The Scenario 1 is the one corresponding to the most likely utilization of a small urban electric vehicle. From the Wavail evolution in Fig. 11 a), it can be concluded that even using the four NiMH small battery packs, it is only possible to drive the vehicle back home for Scenario 1, using the combination Bat+SCs+PVs. The other two scenarios (Scenarios 2 with 80.5 km, and 3 with nearly 150 km) are not possible to carry out with these batteries quantity.
For Case F, using a different combination of Li-ion batteries, PV panels and SCs, it can be concluded from Fig. 12 a) that for Scenario 1, the batteries alone are sufficient to drive the 55 km planned for the journey. However, the batteries would be almost depleted (SOC below 15%), which is dangerous in terms of autonomy reserve or in case of unbalanced batteries, besides being severe for the batteries life time.
Furthermore, for Case F the values presented for the Li-ion batteries’ capacity are for 0.3C that implies a 27 A discharge, which is a quite low value; for bigger discharge rates the capacity will certainly be significantly lower. It is then concluded that the utilization of PVs or SCs could overcome these issues. The SCs also will increase the EV dynamic performances; the batteries’ efficiency and life time are also improved. For the NEDCs in Fig. 12 b), it can be seen that the chosen batteries alone do not have enough energy and so it is clear that the best option with that batteries is to use Bat+PV+SCs (even for November, the SOC at the end of the trip would be around 17 %). However not even with Bat+PV+SCs, is it possible to drive Scenario 3 with this battery pack.
Comparing the graphics a), b) and c) in Fig. 11 and 12, it can also be seen that the relative importance of the regeneration, i.e. of the SCs, decreases. Indeed, as for the 50 km/h cte (graphics c), the regenerative braking energy is negligible, and it is also clear that the SCs do not bring any advantage; in reality, it is the contrary: the weight increase due to the SCs, associated electronics and support structures, increases the energy consumption, decreasing the Wavail relative to the batteries-only solution. It can also be concluded that for extra urban utilization the correct choice is to add more battery packs. This conclusion is regardless the batteries or SCs prices.
Hierarchical management concept suitable for multiple sources EVs
Recently, some authors [40]-[45] have studied the energy storage management in EVs focused on online control and optimization. In [40], the authors use the Energetic Macroscopic Representation to define and implement different strategies for hybrid energy storage systems for EVs. In [42] and [44], stochastic dynamic programming is used to determine an energy management strategy for online control of the power flows during operation considering the stochastic influences of traffic and driver behavior. In [45], an optimal online power management strategy is developed using machine learning and fuzzy logic in order to minimize energy sources’ power losses.
Thereby analyzing the results presented in Section 5.3, it is clear that hybridization of a multiple energy sources for electric vehicles presents a set of requirements for a global energy management system resulting essentially in an energy and power management problem, with several time scales to define implementable solutions for sharing energy and power between the selected sources with different power and energy characteristics.
The management concept is based on the use of all available resources to obtain the desired result efficiently, which implies an effective use and especially the coordination of all available resources to achieve the objectives with maximum efficiency. Thus, the management concept focuses on the organization of all processes, from the point of view of long term-action, always considering the short-term one. Hence, a global process management system it is necessary that involves different levels to form a strategic vision, defining objectives and identifying a strategy, which will then be implemented and imposed. From this definition, there is the applicability of this concept to the energy and power management systems using multiple energy sources.
CLASSIC HIERARCHICAL MANAGEMENT STRUCTURE
Typically, an overall management structure consists of several levels or layers with a hierarchically well-defined chain, as shown in Fig. 13, or even a hierarchical command chain. To achieve a common goal, several agents or decision processes, at each level of this hierarchy, are to receive and perform very different tasks, especially with different time, but always with a collaborative point of view. It is recognized that the highest level of this hierarchy is mainly responsible for the high level guidelines that influence long-term objectives of the process. The directives listed in high level management are therefore referred to the decision process at intermediate level. However, the long-term guidelines, achieved through the implementation of these directives, do not need to be well defined or known in the subsequent levels. But it is essential that the intermediate level receive enough information from the high-level process to make a decision that meets its objectives while respecting the guidelines of the particular level of superior guidance. Likewise, the higher hierarchical level management does not require detailed information on the particular objectives of the intermediate level, and how to execute their long-term orientations.
According to the guidelines and restrictions imposed by management level, the medium level takes decisions almost continuously affecting the system operations based on pre-established policies management. The content of the tactical management level decisions are more interventionist, which leads to a shorter periodicity decision as compared to the high level management. Therefore, at a periodic frame, the upper level may rethink its current strategy and its long-term goals, and as a result, amend its guidelines, which are communicated to the medium level so that its decisions take place. The update rate of these decisions is greater than the change rate of the high level guidelines.
The tasks that carry out the implementation of very specific guidelines for a global system are defined as low level management in classic management hierarchy. The low level management takes quick local decisions which directly influence the process using as boundaries the decisions handed down by the medium level management. The action frequency at the operational level, the lowest management level, is much higher than the frequency of renewal decisions of the higher levels.
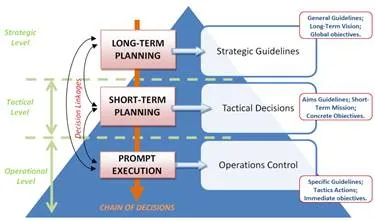
The different decision levels in the hierarchical management structure, shown in Fig. 13, for a given system or process, enables to clearly define the overall objectives, the frequency of decisions (long, medium, and short term) and forms of interaction between the various levels. The modular organization of this strategy approach allows an easy and rapid modification in each module independently without the process management restructuration. Each management module is responsible for a specific purpose defined and is strictly responsible for its decisions and sending decisions/orientations to the down module of the decision chain.
This hierarchical management structure concept provides a systematic dissemination and simultaneously evaluates the process to manage. Given their different nature, the guidelines, decisions and implementations will inevitably have different cadence decision, in which each level shall take its decisions with different cadences, and must be synchronized in time so that no mismatch can occur between the various modules. Thus, the high level responsible for dictating the long-term strategy will have a refresh rate of its objectives slower than the decision level intermediate tactical maker that will decide several times during one cycle of the upper module. The lower level has a responsibility to produce reactions in a very short time, and scarcely have an instant response to any change in the behavior of the process within the guidelines of decision’s modules located hierarchically above. Therefore, the overall process of management is divided into three decision modules with different responsibilities and different times for the revaluation of its decisions.
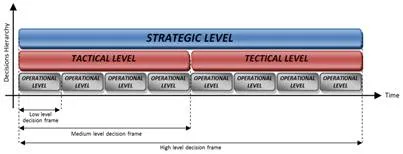
The differentiated step concept of the decision based on each decision module is illustrated in Fig. 14. As shown in this Figure, multiple implementations of the low level module occur before the intermediate level module makes a further decision, and consequently, several decisions of the same level occur before a new guideline consideration is provided by the high level module.
ARCHITECTURE AND HIERARCHY OF THE ENERGY MANAGEMENT SYSTEM FOR HYBRIDIZED EV
It should be noticed that when applying the hierarchical management to organizations or companies, a strict schedule time to make decision is not fundamental. However, for the applicability of this concept to the particular problem of multiple energy sources management, the concept of the classic hierarchical management methodology for a modular management, where decisions are made in a discrete and deterministic way, is mandatory. This is presented in Fig. 14.
As evidenced, the modular hierarchical management methodology has various concepts that can be modeled and adapted to project energy management systems in general and particularly to the management of multiple sources. This approach clearly demonstrates that a global management process with simultaneous objectives (long, medium and short term) can be divided into several smaller processes, where each process has one or more well definable tasks. The fact to distinguish perfectly the natural interconnections between the several management modules with different time scales should also be stressed. This structure has particular interest to the energy management problem of the EV multiple sources, and this question cannot be dissociated from a correct power sharing of the embedded sources or energy storage. The closed relationship between the power (P) and the energy (W) due to those parameters are simply related to each other by a single parameter, the time (t). The relationship between two quantities is characterized by (12).
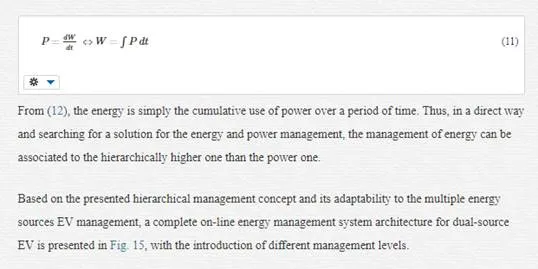
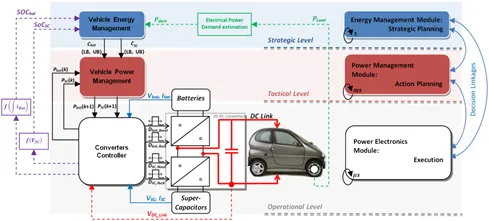
The formulation of the EV energy management problem with multiple sources, with particular emphasis on urban circuits, is primarily based on three fundamental objectives for the correct EV operations. The global results of the management have to maximize the use of the source that best suits the powertrain power demand answering the driver and route requirements. The listed objectives for this problem are: Long-Term Planning (energy management), responsible for the definition of an overall management strategy to produce a set of guidelines to consider in the decisions of lower management levels; Short-Term Planning (power management), whose main function is the definition of actions that will lead the lower level to produce the reference signals to control and perform the wanted operations, and finally, the Prompt Execution (operational control), responsible for the control signals generation in order to implement the guidelines and directives of the two higher levels and command the power electronic converters. Thus, using a top-down approach, the first objective defines a global strategy and therefore defines the guidelines and restrictions that restrict the decision space of the second management level, which together dictate rules to produce control signals that will control the DC/DC converters [46] [47], as presented in the blocs diagram of Fig. 15.
Only an approach based on energy and power management through a hierarchical structure, using various management modules with different responsibilities, may lead us to obtain the good energy efficiency results presented in Section 5.3. These results were achieved considering an optimized management system for on-line energy and power management.
Although hybridization of multiple sources and energy management topics are still open to further study, in the present work we attempted to suggest some wide challenges and describe new research opportunities in order to obtain an effective energy management system for multiple energy sources electric vehicle.
Conclusions
The emphasis of the presented work is on the multiple energy sources hybridization for EVs. A comparative study on the impact of the utilization of different energy sources, namely different types of batteries, SCs and PV panels, for different common scenarios of daily use was done. The importance of considering the efficiency of all the energy chain in the EV was also clearly shown.
Simulation results for the VEIL Project powered by a mix of energy sources were presented and analyzed. At project start, small NiMH modules seemed to be a good option for a typical urban utilization. However, with the Li-ion price decrease, some apparently more interesting solutions appeared in the market. It was shown that the regenerative braking energy can be quite important in urban driving, together with the PV utilization when a typical home-work-home journey is forecast, with long outdoor parked periods. This leads to the need of sources hybridization for urban utilization. Besides the range extension, the PV utilization can also supplement the long-term batteries self-discharge, and in some cases avoid the need of a charge during the day, which can be particularly relevant in terms of energy cost for the EV owner and for grid energy management, especially by decreasing the need for fast charges. The presented methodology, which is quite simple to apply and extend to any EV, can be followed for the correct sizing and choice of the energy sources to use, depending on the assumed utilization, and also to estimate what will be the EV autonomy or its ability to perform different utilizations. This can be used to customize the EV energy sources for the client needs and desires.
Finally, to allow effective multiple energy sources hybridization, the architecture of a three level hierarchic energy management system for a dual-source EV was proposed. This system, with its simulation and hardware implementation has been under development by the authors showing promising results.


Comments are closed