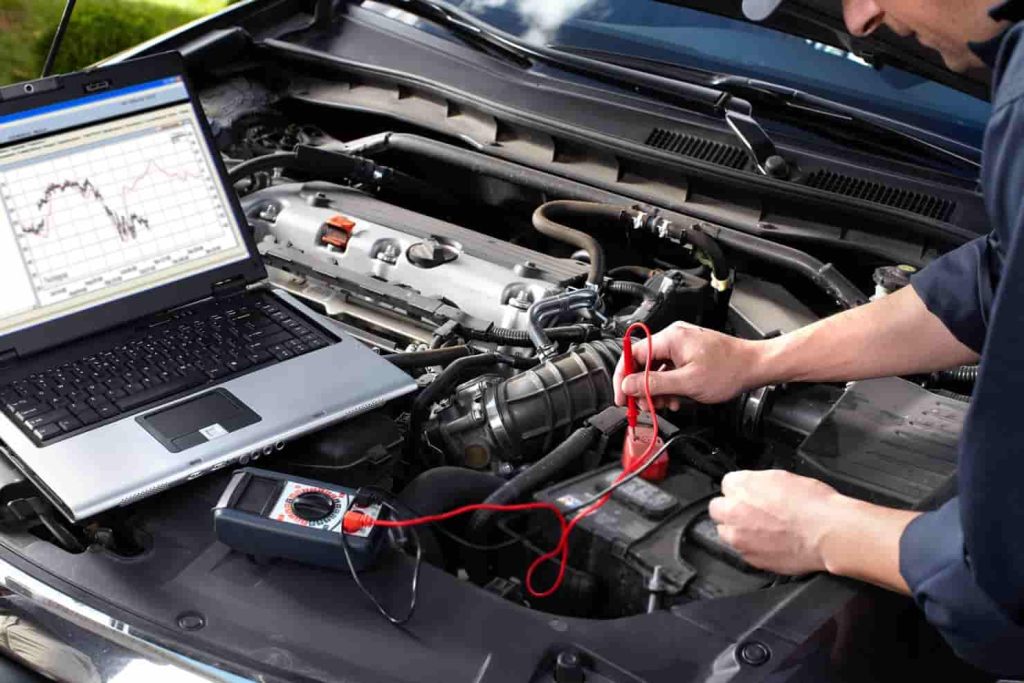
An electric vehicle (EV), also referred to as an electric drive vehicle, uses one or more electric motors or traction motors for propulsion. Electric vehicles are being widely developed due to their better performance than the traditional fuel vehicles in terms of environmental pollution and energy consumption [1-3]. However, comparing with the traditional petroleum vehicles, the relatively short driving distance of the electric vehicle is the main hindrance to prevail. To improve the performance of the electric vehicle and excel the internal combustion engine vehicles, research and study need to be done. In this chapter, analyses and applications are developed to investigate the mechanical behaviors of the electric vehicles such that the performance of the electric vehicles can be considerably improved.
Investigation of the regenerative braking force in electric vehicles
In order to overcome the weakness of the short driving distance, the energy efficiency of the electric vehicle has to be substantially improved [4]. The regenerative braking technology is able to convert the excessive kinetic energy of the vehicle into another form, which can be either used immediately or stored until needed [5]. In this section, the regenerative braking force is analyzed and an optimized control strategy for the regenerative braking process was proposed based on the results of the analysis. With the implementation of this optimized control strategy, the energy efficiency of the electric vehicle can be appreciably improved.
ANALYSIS OF THE REGENERATIVE BRAKING FORCE
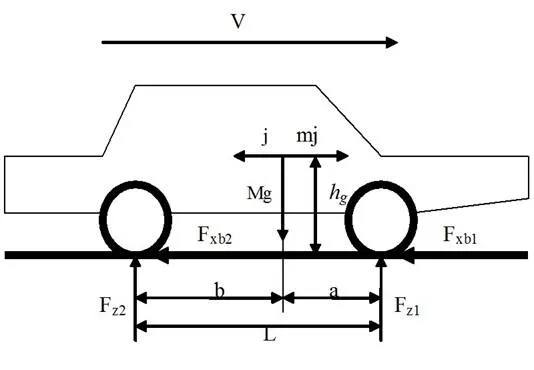
The amount of recovered energy during the braking process depends on the magnitude of the regenerative braking force. In order to achieve the maximum amount of recovered energy, the forces in the front and rear tires of the vehicle during the braking process should be analyzed and distributed at the optimal level. Figure 1 represents a schematic of the vehicle during the braking process in which the deceleration of the vehicle is denoted as j, the gravitational acceleration is denoted by g and the braking forces in the front and the rear wheels are denoted as Fxb1 and Fxb2, respectively.
Force Equilibrium yields:
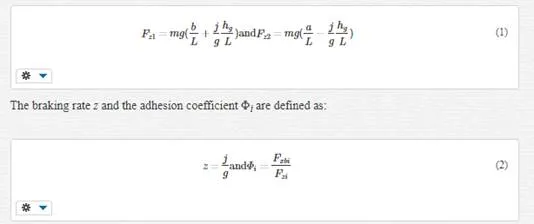
In general, there are three different scenarios due to the various distribution of the braking forces in the front and rear wheels: i) both the front and rear wheels are locked at the same time; ii) the front wheels are locked whereas the rear wheels are unlocked; and iii) the rear wheels are locked whereas the front wheels are unlocked.
The first scenario is the ideal case that has the best braking effect. The relationship between the forces in the front and rear wheels can be derived and expressed as
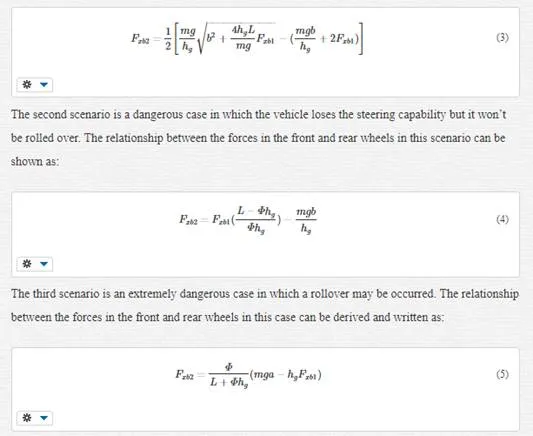
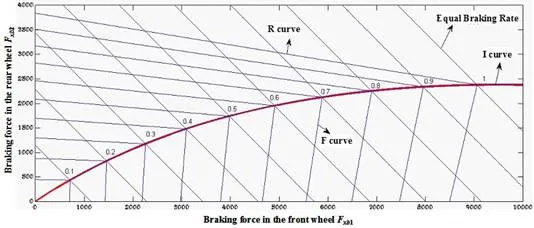
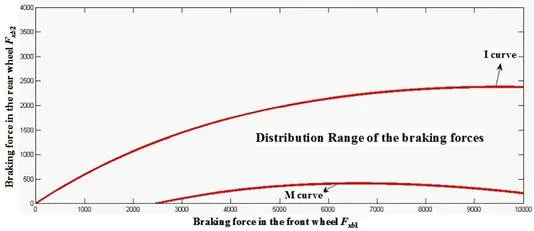
Based on Eqs. (3)~(5), the relationships between forces in the front and rear wheels of the electric vehicle in these three different scenarios can be plotted and shown in Fig.2. I curve, as illustrated with red dark color, represents the first scenario (i.e., the ideal case); the second scenario is represented by a series of F curves; and R curves represent the third scenario which is the extremely dangerous case.
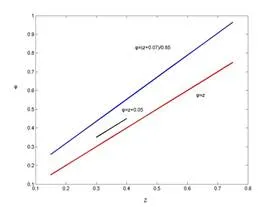
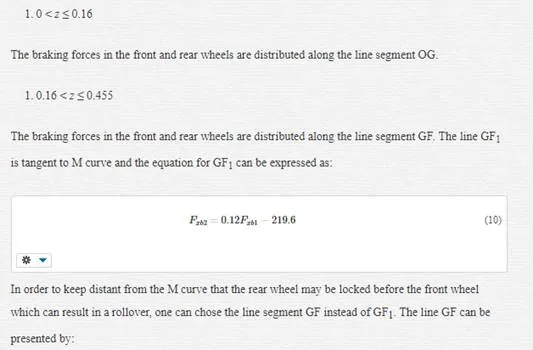
The above analysis reveals that the distribution of the braking forces between the front and rear wheels plays the crucial role on the braking performance of the vehicle. In order to ensure the braking safety of the vehicle, United Nations Economic Commission for Europe (UNECE) established a regulation (ECE R13) which strictly regulates the distribution range of the braking forces between the front and rear wheels, as shown in Fig. 3 [6]. The horizontal axis z represents the braking ratio, and the vertical axis kis the adhesion coefficient between the tire and the road in the figure.
AN OPTIMIZED CONTROL STRATEGY OF THE REGENERATIVE BRAKING
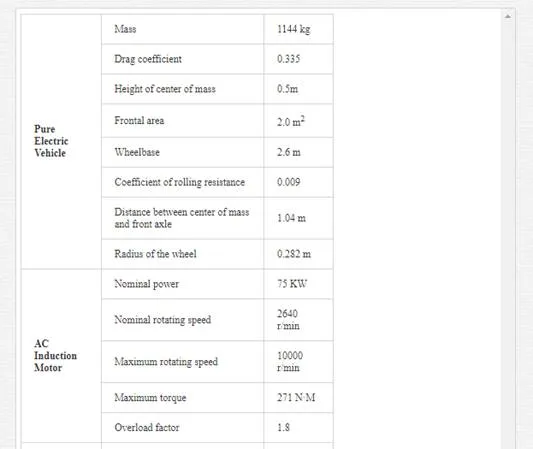
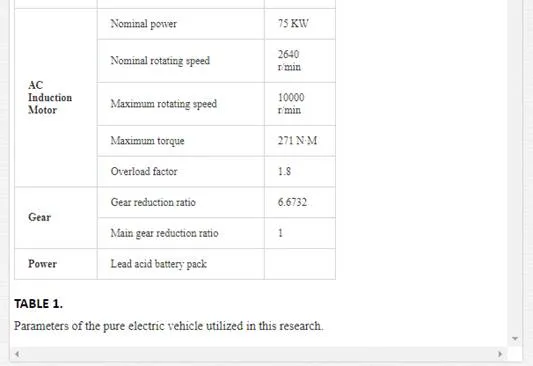
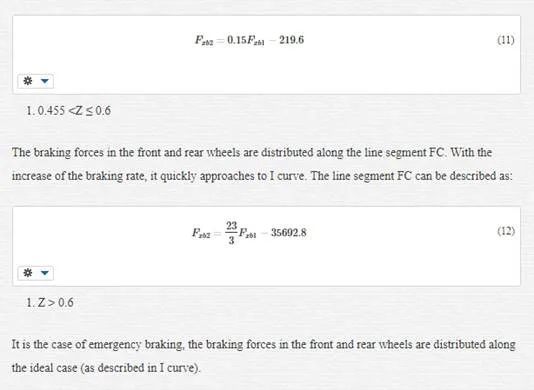
Based on the analysis developed in the previous section, an optimized control strategy of the regenerative braking process is proposed in this section. This proposed control strategy aims at the following three goals: 1) safety of the vehicle braking; 2) maximization of the recovered energy; 3) a simple control system with a low cost of manufacturing. A front-wheel drive pure electric vehicle is utilized in this research, with the parameters listed in Table 1.
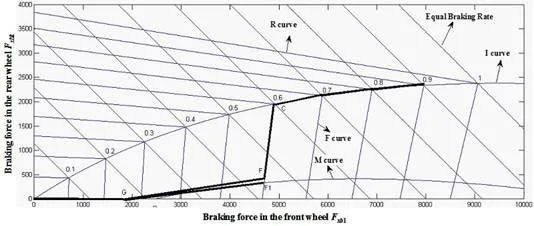
The energy due to the regenerative braking can be recovered when the braking rate is between 0 and 0.6. No energy will be recovered when the braking rate is higher than 0.6. The optimal distribution of the braking forces between the front and rear wheels is presented as the OGFC-I curve shown in Fig. 5
MODELING AND SIMULATIONS
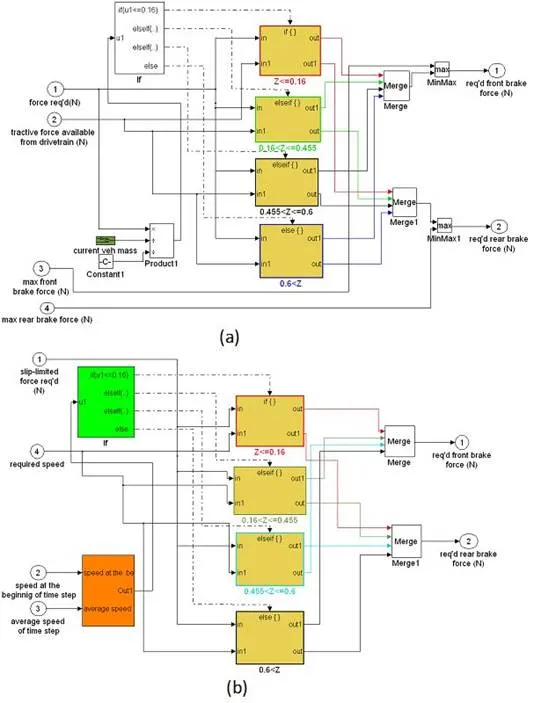
Implementing the optimized control strategy in Section III, the controlling module of the braking force was established and plugged into the commercial software ADVISOR. The distribution modules of the optimized braking forces in the front and rear wheels are shown in Fig. 6.
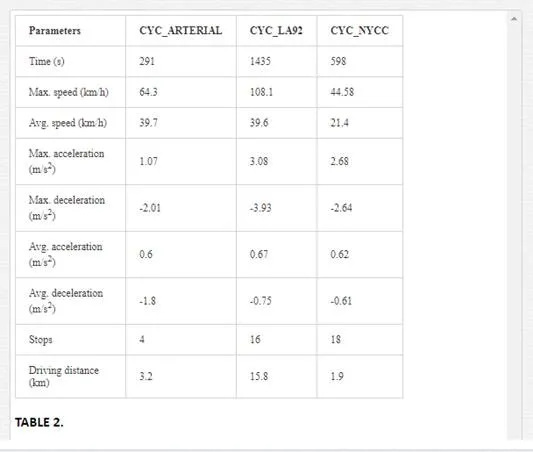
In order to validate this optimized controlling strategy, three drive cycles were used, i.e., CYC_ARTERIAL, CYC_LA92, and CYC_NYCC. The parameters of these three drive cycles are listed in Table 2.
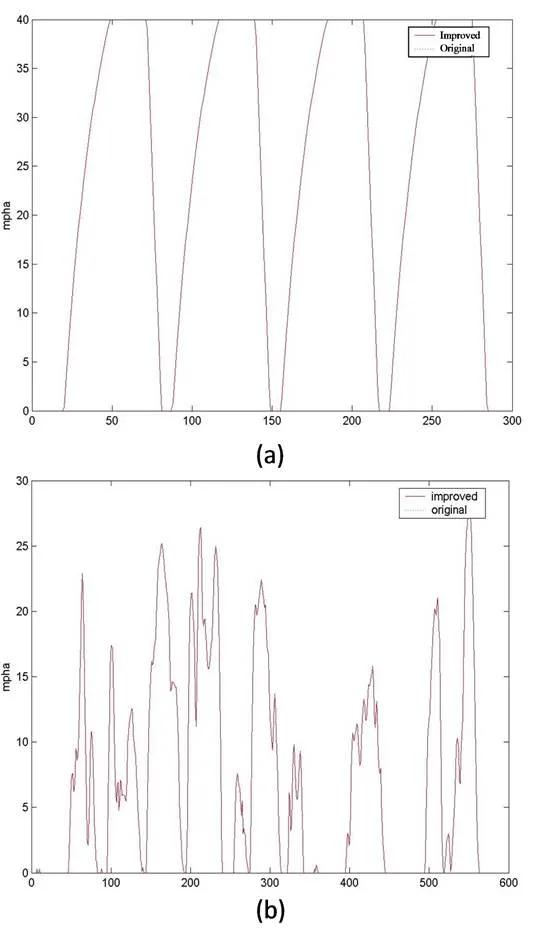
The pure electric vehicle was simulated in these three drive cycles in ADVISOR, using the optimized control strategy. Then the obtained results were compared with the actual (original) results. Figure 7represents the comparisons of the two sets of results in CYC_ARTERIAL and CYC_NYCC drive cycles. It can be seen from Fig. 7 that these two sets of results match very well, meaning that the optimized control strategy did not affect the safety of the vehicle.
The ADVISOR software has a default control strategy which is easy to operate but can not recycle much energy due to the regenerative braking. More importantly, the default control strategy is unable to guarantee a quick and safe stop for the high-speed running vehicle due to the limited amount of regenerative braking force generated during the braking process. Here, the results using the optimized control strategy are compared to the results using the default control strategy provided by ADVISOR.
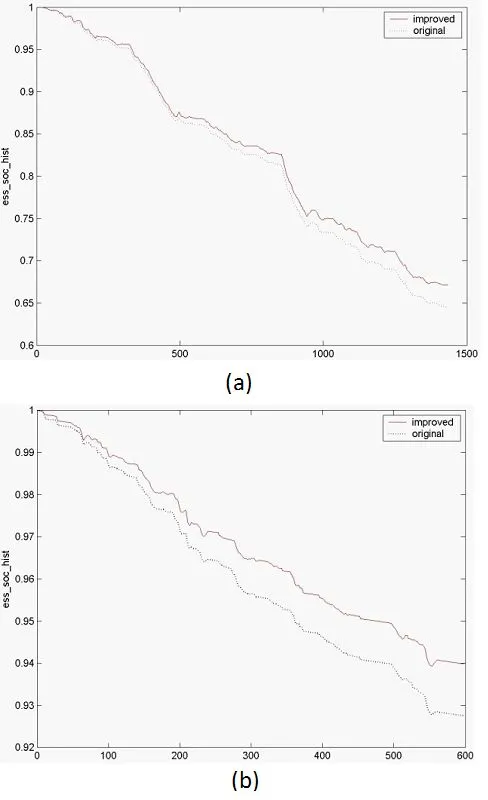
Firstly, the SOC of the battery is selected to be compared by using these two different control strategies. Figure 8 illustrates the comparisons of SOC in CYC_LA92 and CYC_NYCC drive cycles, using the default and optimized control strategies. It can be seen that the SOC curve using the optimized control strategy has a flatter slope than the SOC curve using the default one. It means more electric energy is reserved in the battery and consequently more kinetic energy can be recovered during the regenerative braking process.
Secondly, the recovered energy during the braking process will be compared using these two different control strategies. As listed in Tables 3 to 5, the parameters for comparison include the consumed energy, the braking energy, the total recovered energy, the energy recovery efficiency, the effective energy recovery efficiency, and the energy efficiency of the entire vehicle. The optimized control strategy and the default control strategy in ADVISOR are employed in the three drive cycles.
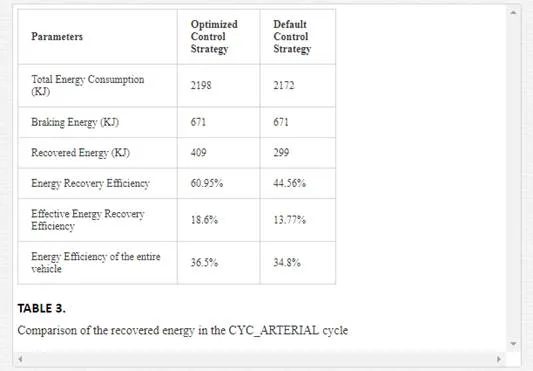
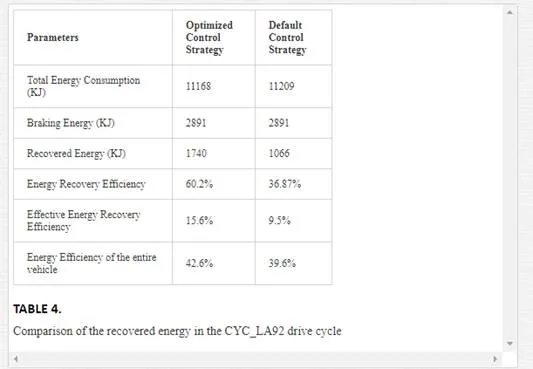
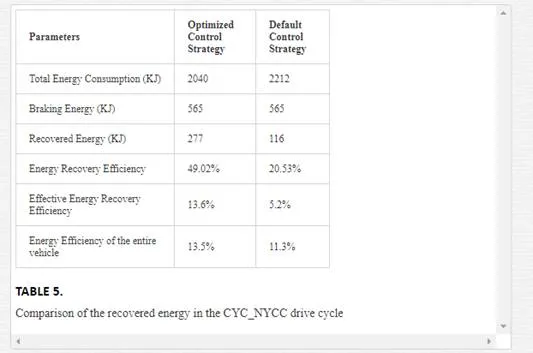
It can be seen from Tables 3 to 5 that with the use of the optimized control strategy, the parameters of all categories have been improved considerably, comparing with the acquired results using the default control strategy. With the same amount of braking energy, the energy recovered from the regenerative braking process has been increased dramatically via the use of the optimized control strategy, for all three drive cycles. For instance, in the CYC_NYCC drive cycle, the amount of recovered energy using the optimized control strategy (i.e., 277 KJ) is more than doubled, comparing to the number (116 KJ) utilizing the default control strategy provided by ADVISOR. In addition, the energy efficiency of the entire vehicle has also been improved for all three drive cycles, via the use of the optimized control strategy. The largest improvement occurs in the CYC_NYCC drive cycle with the amount of almost 20% (13.5% vs. 11.3%), with less total energy consumption (2040 KJ vs. 2212 KJ). The optimized control strategy also prevails over the default control strategy in other categories, as shown in Tables 3to 5.
SUMMARY ON THE ANALYSIS OF THE REGENERATIVE BRAKING FORCE
In this section, the regenerative braking force was analyzed and the distribution range of the braking forces in the front and rear wheels was determined to meet the requirements in UNECE R13. An optimized control strategy of the regenerative braking process was proposed based on the results of the analysis. The regenerative braking process with the optimized control strategy is simulated in the commercial software ADVISOR. Three different drive cycles with real data and the default control strategy in ADVISOR were employed to conduct the comparison. Results of the comparison reveal that the optimized control strategy prevails over the default control strategy in every category of energy recovery. Comparing to the default control strategy, this optimized control strategy can improve the energy recovery efficiency by more than 100% for one drive cycle. This optimized control strategy can also be used for the hybrid vehicles.
Simulation and analysis of Series Hybrid Electric Vehicle (SHEV)
Series-hybrid vehicles are driven by the electric motor with no mechanical connection to the engine. Unlike piston internal combustion engines, electric motors are efficient with exceptionally high power-to-weight ratios providing adequate torque over a wide speed range. In a series-hybrid system, the combustion engine drives an electric generator instead of directly driving the wheels. The generator provides power for the driving electric motors [7]. However, the efficiency of the engine and the working condition of the battery have to be considerably improved to make the series hybrid electric vehicles more competitive in the industry. In order to improve the efficiency of the engine and make the battery work in the better condition, analyses and simulations need to be developed and an optimized control strategy has to be obtained and utilized.
CONTROL STRATEGY FOR SHEVS
OPERATION MODE FOR SHEVS
A typical power control flow for SHEVs can be described by the following four kinds of operation modes, as shown in Fig. 9 [8].
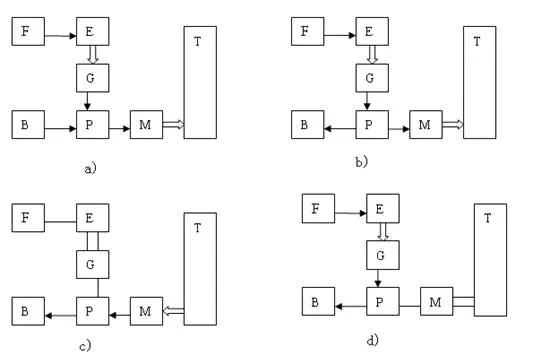
When a SHEV starts to run, the engine outputs the electrical energy via the generator and the battery, transmits the energy to the converter, which drives the motors, ultimately drive wheels through the mechanical transmission devices; When the vehicle is underloaded, the power outputted by the engine is more than the vehicle needs, then the excessive energy is utilized to recharge the battery via the generator, until the SOC reaches the predetermined limit; When the vehicle is braking or decelerating, the motor converts the kinetic energy into the electrical energy, recharging the battery through the power converter; When the vehicle stops, the engine can recharge the battery through generators and power converters.
CONTROL STRATEGY FOR SHEVS
During the SHEV automobile working process, it often happens that energies from two or more sources superimpose. The main purpose of the correct matching of SHEV powertrain is to rationally determine the operating characteristics of the engine and its power distribution and energy balance with the energy storage device. By controlling the working status of various energy sources, the energy conversion efficiency can be improved, the loss due to energy transmission can be reduced, and ultimately the energy can be utilized in a maximum way for SHEVs.
The general control strategy for SHEVs is developed normally based on the parameters such as battery SOC, the driver’s accelerator pedal position, the wheel speed and the average power of the driving wheel; then the engine and electric motor generate the corresponding torque to meet the requirements of the driving torque for the driving wheel. Commonly used control strategies include “thermostat” and “power follower” [9], where the power follower strategy are described as follows:
1. When the battery SOC is greater than the upper limit of SOCmax, the engine stops working, but when the power demand of vehicle is too large, the engine needs to be restarted;
2. When the battery SOC is less than the lower limit SOCmin, the engine needs to get to work;
3. When the engine works, its power output should not only follow the changes of the power demand of the vehicle, but keep the battery SOC around the middle value of its working range;
4. While he engine is working, its output power should not be too small or too large in order to ensure high efficiency.
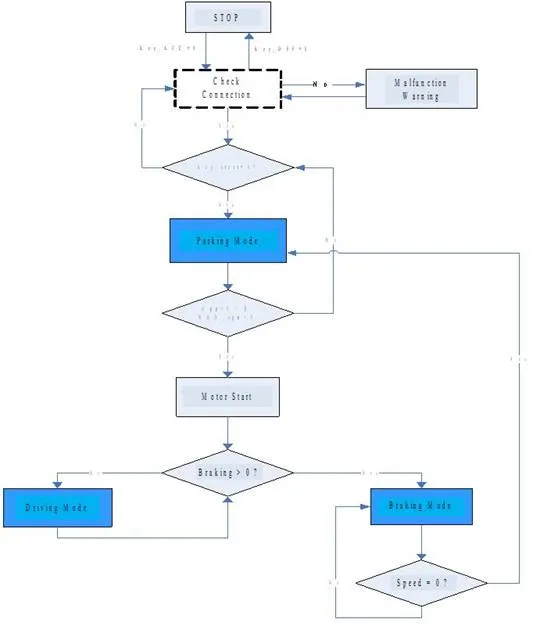
In this research, parameters are controlled to determine the energy flow of SHEVs, so that the control strategy of “power follower + thermostat” is designed. The general logic control flow is shown in Fig. 10.
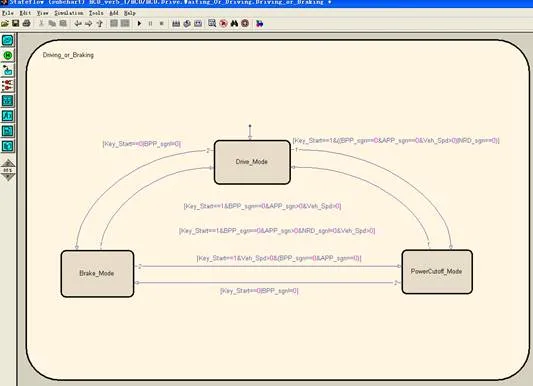
SIMULINK/STATEFLOW CONTROL PROCESS
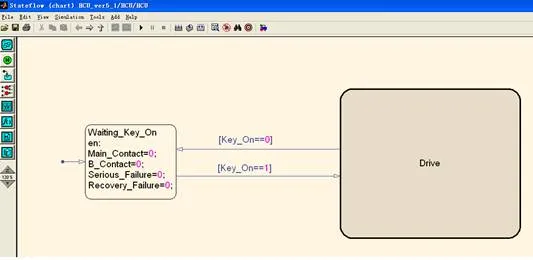
Based on the above analysis, one can establish the vehicle control systems in the SIMULINK/Stateflow based on the energy flow of vehicles. Modeling in the SIMULINK/Stateflow, one can not only avoid the complex programming in MATLAB, but omit the direct construction of control frame in the SIMULINK. Furthermore, the status flow in Stateflow can explicitly represent the control process with figures, so that the control can be precisely achieved. Based on the above analysis and the energy flow analysis and control chart, the control flow designed in the SIMULINK/Stateflow is shown in Fig. 11.
SIMULATIONS OF SHEVS
ADVISOR employs a unique hybrid simulation method, which mixes the backward simulation and the forward simulation, with the backward simulation as the primary one and forward simulation as the auxiliary one [10]. It first carries on the backward simulation along with the opposite direction to the actual power flow, making the request of the needed speed and torque to the vehicle model according to requirement of the path circulation. Then the vehicle model delivers the request to the wheel and the axle module, to the main gearbox module, to the transmission gearbox module and so on, until the request is delivered to the power supply module, then the power provided by the power supply can be calculated. Next, it carries on the forward simulation; a stepwise computation will be developed along the actual direction of the power flow, until the automobile’s real speed is determined.
POWER MATCHING OF VARIOUS PARTS OF VEHICLES
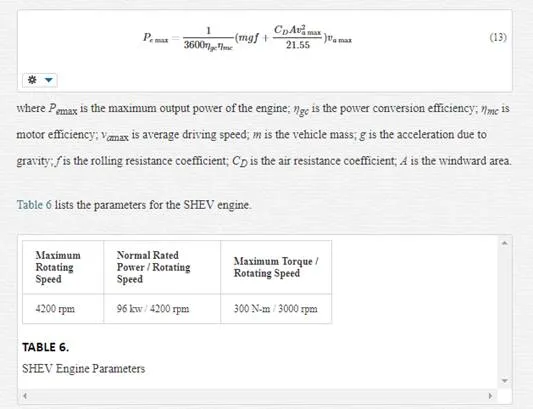
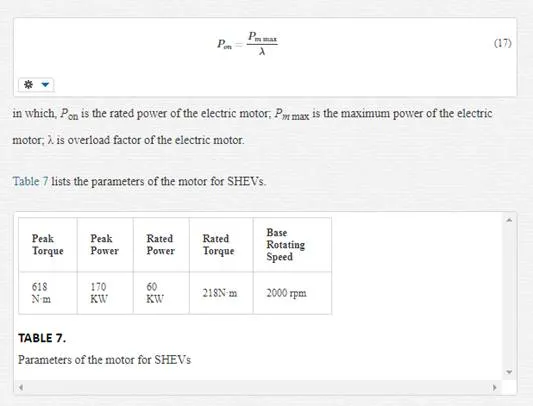
POWER SELECTION FOR ENGINES
SHEVs have the similar requirements to ordinary vehicles on dynamic performance, and continuous driving distance has to be independent of battery capacity, thus the engine’s maximum output power needs to satisfy [11]:
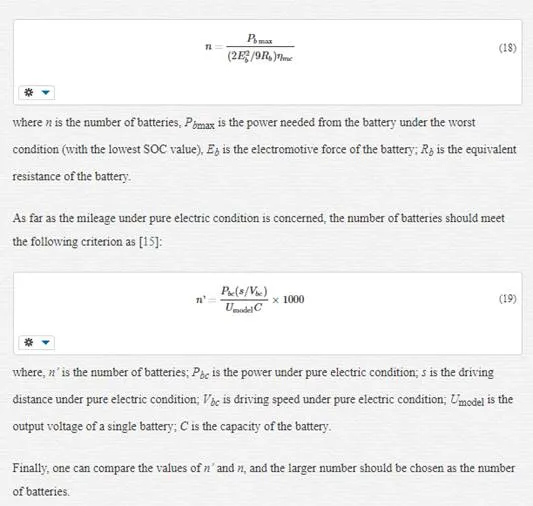
SELECTION OF PARAMETERS FOR BATTERIES
For the hybrid vehicles, the larger of battery capacity, the longer the vehicle can drive under the pure electric condition. However, larger capacity means larger weight and volume. Therefore, we should choose the battery based on several key factors, including the technical specifications of the vehicle, the specific energy and specific power of the battery. The selection of the number of batteries should be based on the needs of electric power and the mileage under pure electric condition.
First, from the aspect of the power need, the battery capacity must meet the maximum requirements of the output power of the motor. The number of batteries needed can be determined by the following formula [14]:
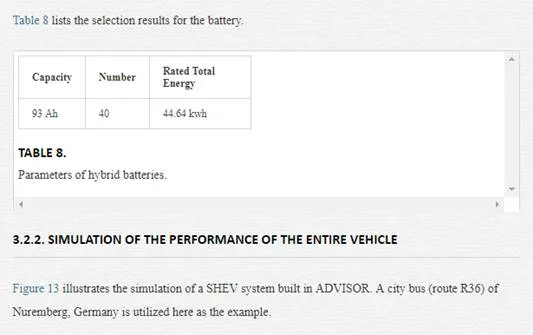
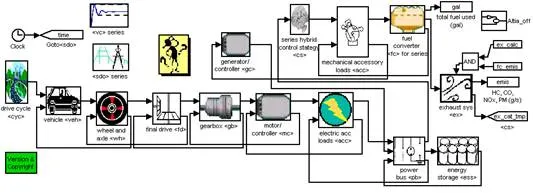
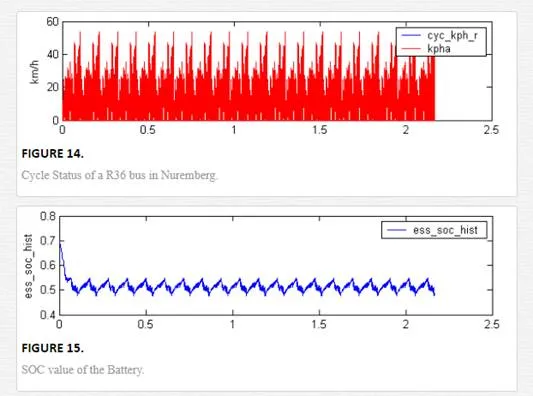
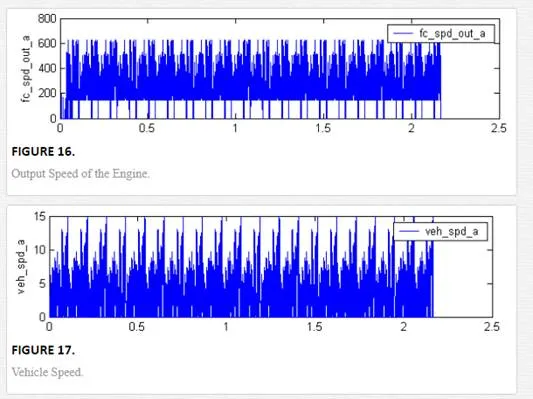
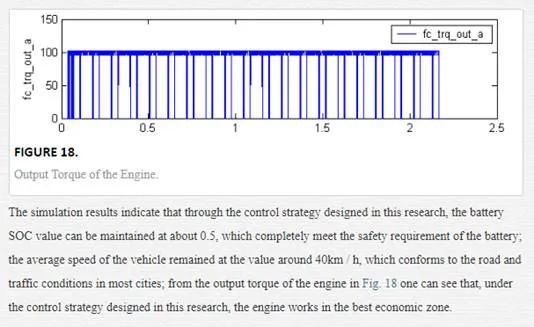
The cycle status of this SHEV is shown in Fig. 14. Embedding the control frame illustrated in Fig. 11into the system shown in Fig. 13, and setting the values for the parameters of various parts that were calculated in previous sections, one can obtain the simulation results as shown in Figures 15~18, with Fig. 15 representing the SOC value of the battery, Fig. 16 illustrating the output speed of the engine, Fig. 17 presenting the speed of the entire vehicle, and Fig. 18 showing the output torque of the engine, respectively
SUMMARY ON ANALYSIS OF SERIES HYBRID ELECTRIC VEHICLE
In this section, the simulations and analysis of the series hybrid electric vehicles (SHEVs). According to the technical specifications of SHEVs, a control strategy was designed utilizing the power follower and thermostat, while parameters were selected for various part of the SHEV. Simulation results revealed that this control strategy can not only meet the performance requirements of the vehicle, but make the engine and batteries work in a reasonable range. The study and optimization of the control strategies are the hotspots in the field of hybrid power system. The optimization of control strategies is not only to achieve the best fuel economy, but to adjust to various operating conditions. In particular, since all the countries are implementing the environmental protection to have a greener earth, the minimum vehicle emission becomes a crucial measurement for the superiority of a control strategy for SHEVs.
Investigation of the temperature distribution in the Li-ion battery for pure electric vehicles
The lithium-ion batteries have much more excellent performance than the other types of batteries so that they are widely used in the electric vehicles (EVs) [16-18]. However, the Li-ion battery is very sensitive to the temperature variation. One needs to consider not only the temperature range of the batteries, but the temperature difference of each battery in the pack. Low temperature can result in insufficient electrochemical reaction inside the battery, whereas high temperature will affect the working condition so that it shortens the life of service of the battery. Furthermore, the overshoot or overdischarge may be happened in some batteries if the temperature distribution among the battery pack is nonuniform. In order to minimize the heat generated in the battery pack, the temperature distributions in the battery and the battery pack utilized in EVs are investigated and parameters are optimized to lower the temperature and non-uniformity of the temperature distribution.
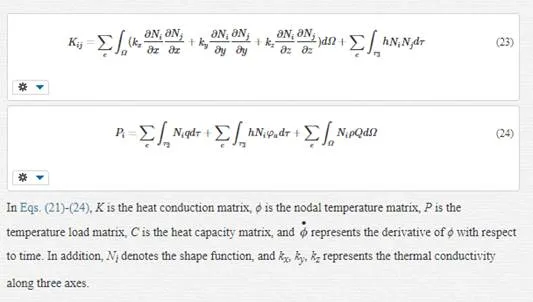
FE FORMULATIONS OF THE HEAT CONDUCTION EQUATION OF THE LI-ION BATTERY
The heat conduction equation in the Cartesian coordinates is given as [19]:
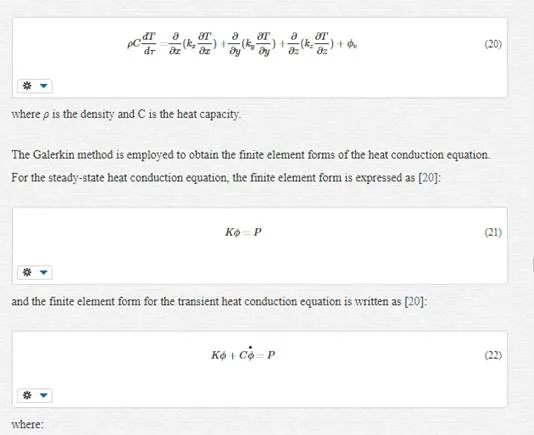
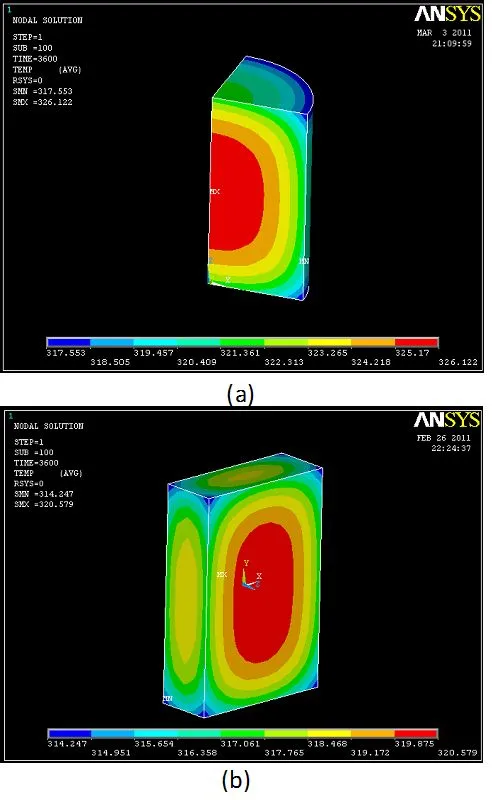
FINITE ELEMENT SIMULATIONS OF THE LI-ION BATTERY
EQUIVALENT MATERIAL PROPERTIES OF THE BATTERY
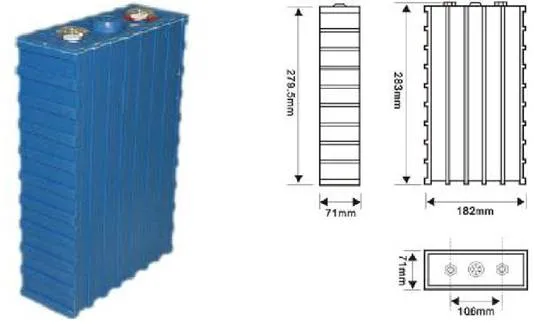
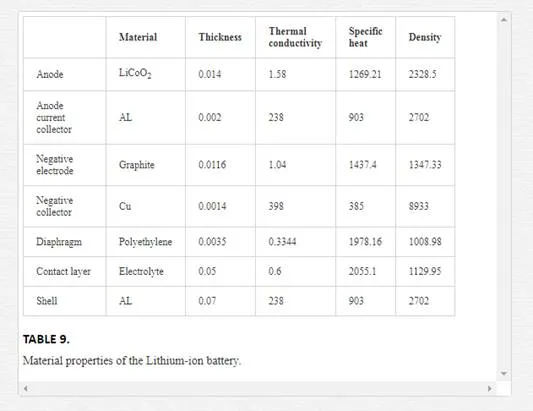
Figure 19 illustrates the rectangular Li-ion battery employed in this research. It has the height of 280 mm, the depth of 71 mm, and the width of 182 mm. The internal structure of the Li-ion battery mainly includes three parts: the shell, the contact layer and the central area. The central area is the heating zone of the battery since most reactions are occurred in the central area.
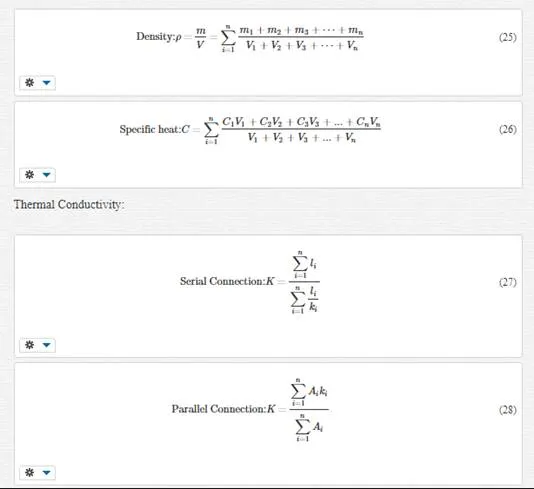
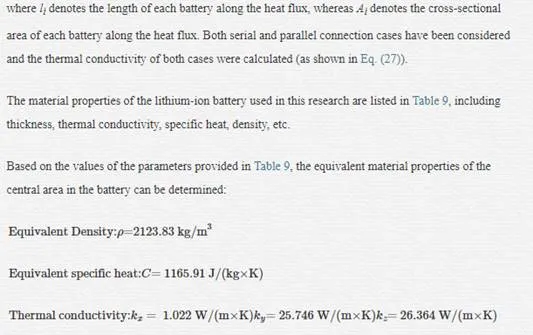
The central area is the most complex area of the battery since it is stacked with hundreds of layers made of different materials. Therefore it is essentially infeasible to generate and implement finite element models of the entire battery incorporating the actual structures. Consequently, equivalent modeling techniques must be developed to investigate the temperature distribution of the battery while circumventing the time and intense computational requirements. In other words, equivalent material properties need to be calculated and utilized in the finite element models. Eqs. (25)-(28) represent the calculations of the equivalent material properties of the battery:
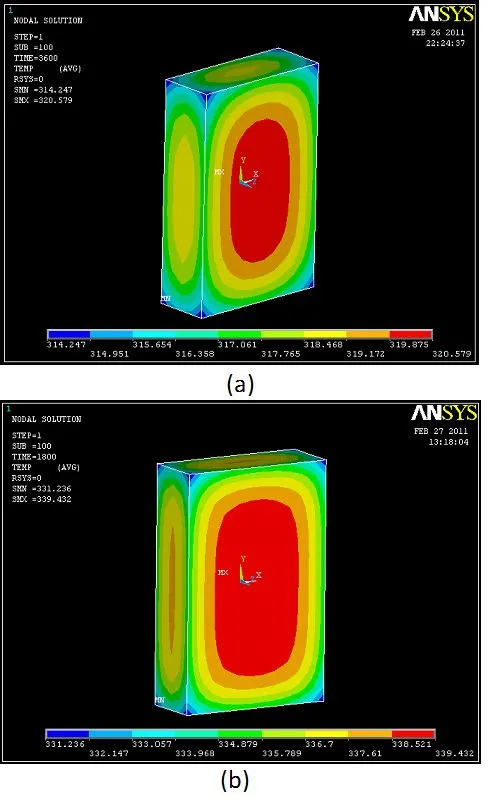
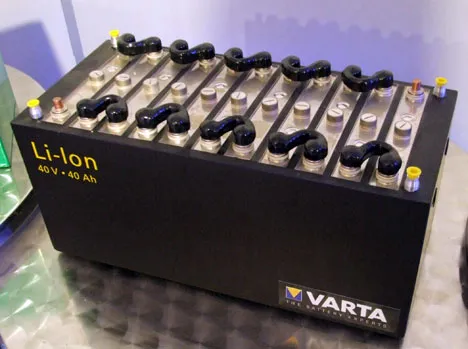
The effect of the discharge rate of the battery on the temperature distribution of the battery pack was also investigated. Figure 21 illustrates the temperature distribution in the battery with different discharge rates. The comparison between Fig. 21(a) and Fig. 21(b) reveals that the temperature of the battery with a faster discharge rate is higher than the temperature of the battery with a slower discharge rate. A slower discharge rate should be chosen to lower the temperature and decrease the temperature difference in the battery. Due to the demand of high power, EVs usually employ battery packs in which each pack consists of tens of batteries. Figure 22 shows a typical Li-ion battery pack used in the EVs [21].
The cooling strategy of the battery pack is investigated by considering two different strategies. In the first strategy, the cooling gas (air) is blowing along the longitudinal direction of the battery pack, it is called the serial cooling; in the second strategy, the cooling direction is perpendicular to the longitudinal direction of the pack, it is called the parallel cooling.
Figure 23 illustrates the temperature distributions in the battery pack using the serial cooling strategy with two wind speeds (4 m/s and 10 m/s). The choice of these two values is based on the critical wind speed (4.2 m/s), calculated based on the critical Reynolds number of 500000 to differentiate the laminar flow and the turbulent flow.
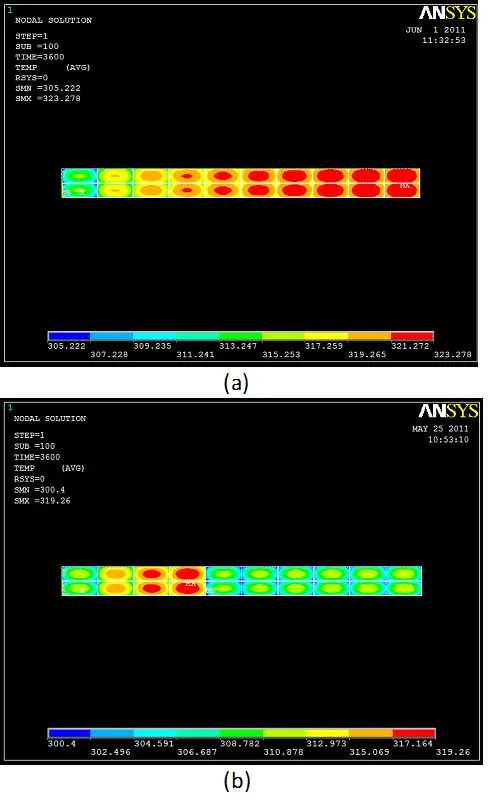
It can be seen in Fig. 23(a) that the air flow will turn to be the turbulent flow at the speed of 10 m/s which is much larger than the critical value of the wind speed (4.2 m/s). Furthermore, it can be seen that there are quite large temperature differences (about 19 degrees) in the battery pack for both wind speeds, which will deteriorate the batteries in the long term.
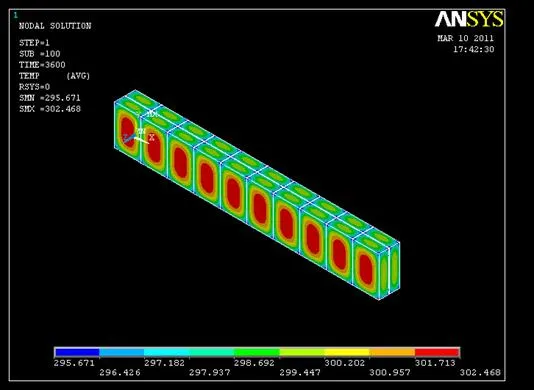
The temperature distributions in the battery pack using the parallel cooling strategy is presented in Fig. 24. The battery pack is under the condition of 1C electric charge and 293K temperature. The convection coefficient is 50 W/m2 K. It can be seen that the maximum temperature difference in the battery pack is less than 7 degrees. The temperature distribution is the same for each battery. Comparing Figs. 23 and 24, one can easily see that the parallel cooling strategy is much better than the serial cooling strategy in this category.
SUMMARY ON INVESTIGATION OF THE TEMPERATURE DISTRIBUTION IN THE LI-ION BATTERY
In this section, the finite element formulations of the heat conduction equation of the Lithium-ion battery are established for both steady state and transient sate cases. Then the boundary conditions of the battery were discussed and the heat convection coefficients were determined for each surface of the battery. A parametric study was developed to investigate and optimize the temperature distribution in the battery. Finite element results indicate that a rectangular shape battery should be chosen to minimize the temperature difference in the battery. Results also revealed that a slower discharge rate needs to be selected to not only lower the temperature inside the battery, but make the temperature distribution in the battery as uniform as possible. Finally, the Li-ion battery pack was investigated and different cooling strategies were studied. Investigation indicates that the parallel cooling should be chosen to accelerate the heat dissipation and minimize the temperature difference in the battery pack. To acquire more accurate results on the temperature distribution in each battery and the entire battery pack, much more sophisticated finite element models need to be established to simulate the real structure inside the battery.
Summary and conclusions
In this chapter, the mechanical behaviors of the electric vehicles were investigated to improve the performance of the electric vehicles such that they can prevail over the conventional petroleum vehicles in the near future. Three different aspects of the electric vehicles were analyzed and substantially improved via the use of various methods.
Firstly, the regenerative braking force in the pure electric vehicle was analyzed and the distribution range of the braking forces in the front and rear wheels was determined to meet the requirements in UNECE R13. An optimized control strategy of the regenerative braking process was proposed based on the results of the analysis. Simulation results indicate that this optimized control strategy can considerably improve the energy efficiency of the regenerative braking process, as well as that of the entire vehicle. This optimized control strategy can also be used for hybrid vehicles.
Secondly, series-hybrid electric vehicles (SHEVs) were investigated to improve the efficiency of the engine and the working condition of the battery. According to the technical specifications of SHEVs, a control strategy was designed utilizing the power follower and thermostat, while parameters were selected for various part of the SHEV. Simulation results revealed that this control strategy can not only meet the performance requirements of the vehicle, but make the engine and batteries work in a reasonable range. The study and optimization of the control strategies are the hotspots in the field of the hybrid power system.
Finally, the temperature distribution in the lithium-ion battery for pure electric vehicles are studied and analyzed. Finite element formulations of the heat conduction equation of the Lithium-ion battery; boundary conditions of the battery were discussed and the heat convection coefficients were determined for each surface of the battery; then a parametric study was developed to investigate and optimize the temperature distribution in the battery. Results indicate that a rectangular shape battery should be chosen to minimize the temperature difference in the battery and a slower discharge rate is needed to make the temperature distribution in the battery as uniform as possible.
The research and study developed in this chapter have not only substantial theoretical values but also significant practical values. The results obtained in this chapter provide clear guidelines for the electric vehicle manufacturers to improve the quality and competitiveness of the electric vehicles such that they will be able to prevail the automobile industry in the near future.