Diesel and lean-burn engines provide better fuel economy and produce lower CO2 emissions compared to conventional Otto gasoline engines. However, the NOx gas components in the lean (oxidizing) exhausts from diesel and lean-burn engines cannot be efficiently removed with the classical three-way catalyst (TWC) under operating conditions with excess of oxygen in the exhaust gas. Among the available technologies under research, the NOx storage-reduction (NSR) catalyst seems to be the most promising method to solve the problem. Basically, NSR catalysts consist of a cordierite monolith washcoated with porous alumina on which an alkali or alkali-earth oxide (e.g. BaO) and a noble metal (Pt) are deposited. These catalysts operate under cyclic conditions. During the lean period, when oxygen is in excess, the platinum oxidizes NO to a mixture of NO and NO2 (NOx), which is adsorbed (stored) on Ba as various NOx species (nitrate, nitrite). During the subsequent short rich period, when some reductant (e.g. H2) is injected, NOx ad-species are released and reduced to nitrogen on Pt. Ammonia and N2O byproduct formation upon NOx reduction can also be observed over Pt-BaO/Al2O3NSR catalysts.
In this chapter a systematic methodology for preparing Pt-Ba/Al2O3 NSR monolith catalysts is presented, the NOx storage and reduction mechanisms on the catalyst are analysed, and the optimal control of different operational variables to achieve the NSR process with maximum production and selectivity to nitrogen is modeled [1].
Historical background
Main pollutants generated in the engine exhaust gases are nitrogen oxides (NOx), carbon oxides (COx), hydrocarbons (HC) and particulate matter (PM). The last term is referred to small particles leaving the engine, mainly constituted by carbonaceous material. These fine particles can enter into the human lungs, being responsible for some breathing and cardiovascular diseases [2].
The hydrocarbons are organic volatile compounds able to form ozone smog at the ground level when interacting with nitrogen oxides under the sun light. Ozone irritates the eyes, hurts the lungs, causes asthma attack and aggravates other respiratory problems. In addition, ozone is one of the primary components of photochemical smog (or just smog for short). Furthermore, hydrocarbons can also cause cancer [3].
Nitrogen oxides, same as hydrocarbons, are precursors for ozone formation. The NO2 contributes importantly to the formation of acid rain [4]. The carbon monoxide (CO) reduces the oxygen flow in the blood and results particularly dangerous for people with heart diseases [5]. The carbon dioxide (CO2) is a greenhouse gas able to make an atmosphere layer trapping the heat and contributing to the global warm of the earth [6].
LEGISLATION
The negative impacts of those emissions on the human health and the environment and climate have forced legislation to control and limit such emissions. In the U.S.A., NOx emissions from mobile sources contribute almost 50 % of those produced in total, so that more and stricter regulations have been introduced for reducing NOx emissions from the automobiles [7].
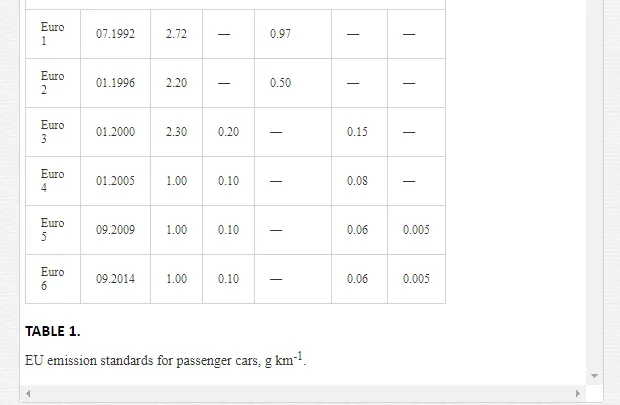
Table 1 shows the most important regulations as introduced by the European Union from the first directive Euro 1 (1992), then Euro 2 (1996), Euro 3 (2000), Euro 4 (2005), Euro 5 (2009), and the most recent Euro 6 (2014) [8]. Emission limits for CO, HC, NOx, and PM were proposed for petrol and diesel engines. Former regulations limited HC+NOx jointly, which later were split up into individual HC and NOx limits.
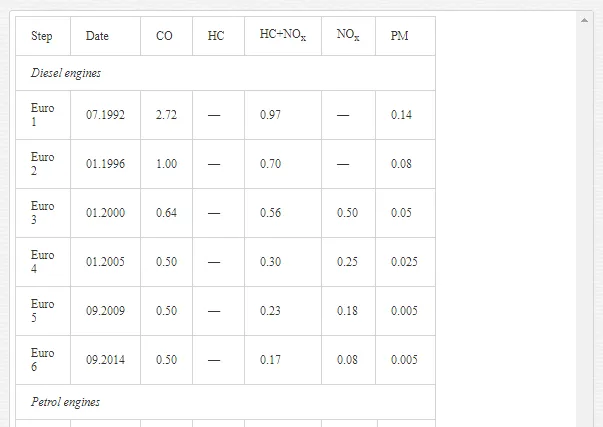
On the other hand, Euro standards have been completed with stricter regulations for sulphur content in fuels. In fact, the content of S in diesel could not surpass 350 ppm from the year 2000, and only 50 ppm from 2005 (for petrol, 150 ppm in 2000 and 50 ppm in 2005). From 2009, S-free fuels (S ≤ 10 ppm) have been implemented.
In the most recent Euro standards the durability of the catalyst is also specified, e.g. Euro 3 required the emission standards for 80,000 km or 5 years (whatever first occurs). Following regulations required 100,000 km or 5 years. From 2000, with the entrance of Euro 3, vehicles should be equipped with on board diagnostics (OBD), announcing to the driver the system damage or wrong operation, then causing higher emissions which should be avoided.
AUTOMOBILE EXHAUST AFTERTREATMENT
More exigent legislation on automobile exhaust emissions has led to the development of aftertreatment systems. Today, three way catalysts (TWC) oxidize CO and HC to CO2 and H2O, and simultaneously reduce NOx to N2 in a very efficient way for conventional Otto gasoline engines [9-12]. The conventional gasoline engines operate at stoichiometric air/fuel ratio, A/F=14.63 (w/w) [13,14], which produces an exhaust gas with the exact balance of CO, H2 and HC (reducing species) needed to reduce NOx and O2 (oxidizing species). However, diesel engines operate with higher A/F ratios, from 20:1 to 65:1 [15], then producing an exhaust gas with oxygen in excess (Table 2 [16]).
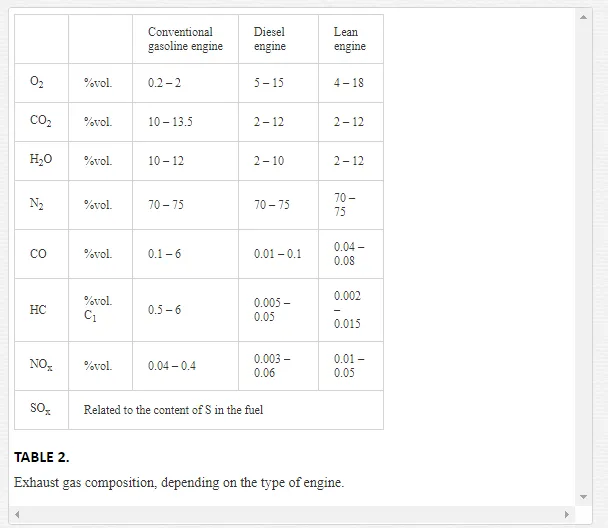
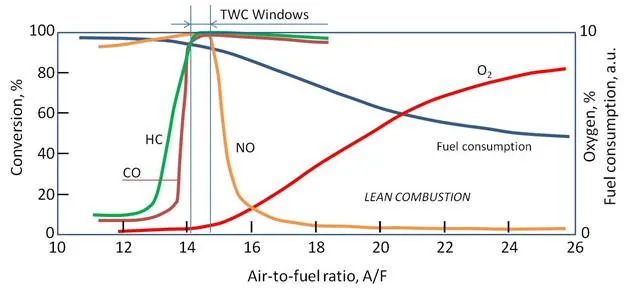
Fig. 1 shows the conversion curves for each pollutant as a function of the air/fuel ratio, for a TWC. Around the stoichiometric point (A/F=14.63), all the three pollutants (HC, CO and NO) are highly converted (>95 %), i.e. they are almost totally removed. However, when the environment is abundant in oxygen as in diesel engines (A/F>20), although this environment enhances the oxidation of HC and CO, the reduction of NO becomes practically inefficient, then this pollutant cannot be appropriately removed with TWC technology [15,17,18].
On the other hand, technical solutions existing for the optimal compromise in removal of NOx/PM [19], by exhaust gas recirculation (EGR), are not able to achieve the requirements of Euro 6. In fact, in these systems, reduction of PM means eventually an increment of NOx and viceversa [20]. Consequently, current technologies combining diesel particulate filters (DPF) and DeNOx catalysts [21-23] are being reconsidered.
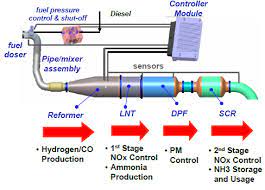
At present, the removal of NOx in the diesel engine exhaust gases, mainly in heavy-duty lorries, is controlled by selective catalytic reduction (SCR) with ammonia generated by hydrolysis of urea which must be stored in an on-board container [24,25]. For light vehicles and passenger cars running under lean conditions, the NH3-SCR technology is not appropiate because of the volume of the needed ammonia container. Thus, other technologies are being developped, including the SCR with the presence of reductants in the exhaust, e.g. hydrocarbon [26], and the NOx storage and reduction (NSR) [27-34], which seems to be the most promising technology and to which is dedicated in this chapter.
GENERAL ASPECTS OF THE NSR (NOX STORAGE AND REDUCTION) CATALYSIS
Up to day, the NSR is considered as the most promising technology for NOx removal from diesel engine exhaust gases. The corresponding devices are also denominated lean NOx traps (LNT). Recent excellent revisions can be found in the literature on this technology [34-36]. Following is a brief summary of the chemical principles used in NSR as to facilitate understanding of next sections.
The NSR catalysts run cyclically under lean environment (oxidizing) and rich environment (reducing), being defined by the corresponding A/F ratios. The concept was introduced by Toyota in the middle 90s [27,33]. While running on the road, lean and rich conditions have to be used in an alternative way [37,38]. Under lean conditions, with excess of oxygen (high A/F), NOx are adsorbed on the catalyst, and then under rich conditions (A/F<14.63) the stored NOx are released and reduced. Consequently, an NSR catalyst needs sites for NOx adsorption (alkaline or earth-alkaline compounds) and also sites for NOx oxidation and/or reduction (noble metals, as in the TWC technology). Most studies in the literature have used storage materials based on Ba. Also other metals such as Na, K, Mg, Sr and Ca have been used. Thermodynamic and kinetic data demonstrated that basicity of alkaline and earth-alkaline metals is related directly to the NOx storage capacity, i.e. the storage behavior at 350 °C decreases as follows: K > Ba > Sr ≥ Na > Ca > Li ≥ Mg [34].
The noble metals are normally incorporated with very low percentage, 1-2 wt %. As in the TWC technology, platinum, palladium and rhodium are mostly used [39]. The metal participates into two important steps of the NSR mechanism, the oxidation of NO to NO2 during the lean period and the reduction of NOx released during the rich period. In general, it is stablished in the literature that Pt is a good catalyst for NO oxidation, while Rh is more active for NOx reduction. Obviously, the storage compounds as well as the noble metals should be dispersed on porous materials with high surface area (Al2O3, ZrO2, CeO2, MgO) washcoated over a monolithic structure, usually cordierite. The most studied formulation in the literature has been Pt-Ba/Al2O3, which has also been chosen for this study.
Presently, it is well assumed that the NSR mechanism can be explained by the five following steps, as represented in the upper scheme of Fig. 2 [34,35]:
a. Oxidation of NO to NO2 (lean conditions, oxidizing environment).
b. Adsorption of NOx as nitrites or nitrates on the storage sites (lean period, oxidizing environment).
c. Injection and evolution of the used reductant agent (H2, CO or HC).
d. Release of the stored NOx from the catalyst surface to the gas stream (rich period, reducing environment).
e. Reduction of NOx to N2 (rich period, reducing environment).
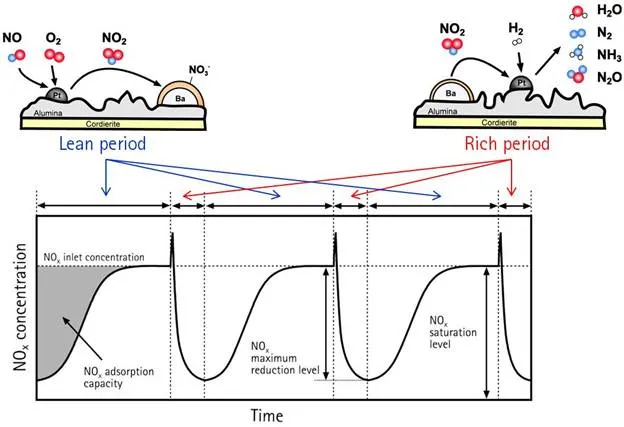
The typical NOx storage and reduction behaviour can be observed in the bottom graph of Fig. 2. At the beginning of the lean period nearly all the NOx (NO+NO2) entering the trap is adsorbed, afterwards the NOx outlet concentration progressively increases due to the successive saturation of the available trapping sites. When saturation is completed, NOx outlet concentration equals the NOx inlet concentration. During the subsequent rich period, when H2 is injected, the adsorbed NOx species on the catalyst surface react with hydrogen to form N2O, NH3 or N2, resulting in the regeneration of the trap which is again ready for the following lean period.
Preparation procedure of monolithic NSR catalysts
Most work dealing with NOx storage and reduction technology have normally used powder catalyst to carry out different studies. However, for real application, NSR catalysts have to be synthesized in a monolithic structure in order to minimize the pressure drop in the catalytic converter [40-42]. The preparation procedure of powder or monolithic catalysts differs notably. While conventional techniques are used for the incorporation of the active phases in powder catalysts, such as wetness impregnation [43-45], the synthesis of monolithic catalysts requires more sophisticated techniques. This section will be focused on the preparation procedure of monolithic NSR catalysts, paying special attention on their final physico-chemical characteristics (dispersion and distribution of the active phases) and their correlation with the activity for NOx storage and reduction.
In real application, the mechanical properties of the catalyst are crucial due to the dramatic temperature changes and vibrational strengths that are expected. In this sense, cordierite (2MgO.2Al2O3.5SiO2) has been chosen as the base material in automotive application due to its high thermal stability and low expansion coefficient. However, this material exhibits a low surface area which is not suitable for the subsequent incorporation of the active phases. Consequently, the first step of the catalyst preparation consists on the monolithic substrate washcoating with a high surface area oxide, usually alumina.
The most common washcoating procedure is carried out by dipping the monolith into slurry which contains the alumina for washcoating. The monolith is immersed in the slurry for a few seconds and then removed, and the excess of liquid remaining in the channels is blown out with compressed air. This procedure is repeated until the desired Al2O3 weight is incorporated as washcoat. It has been previously reported that the characteristics of the final coated monoliths are governed by the properties of the slurry [42], considering as main variables the Al2O3 particle size, the Al2O3 wt % in the slurry and the pH. Agrafiotis et al. [46] found a threshold value of particle size around 5 µm which is coincident with the size of the cordierite macropores; larger alumina particles do not penetrate into the macropores of the substrate resulting in a poor anchoring of the alumina layer. Therefore, the smaller the particle size in the slurry, the higher the alumina layer anchoring is. In fact, in our previous work [47], the immersion of the monoliths in an alumina slurry with a particle size distribution centered in 1 µm, led to a highly adhered alumina layer, with a weight loss smaller than 0.25 % after the washcoated monolith was immersed in ultrasound bath for 15 min. Regarding the Al2O3 wt % in the slurry, two contradictory effects are observed. On one hand, as the slurry concentrates in Al2O3, few immersions are required to achieve a given amount of washcoated alumina, but on the other hand, the increase in the slurry viscosity resulted in non-homogeneous coating. The influence of the slurry viscosity on the alumina layer homogeneity has been associated with the ease for the suspension excess to be blown out from the monolith channels [48-50]. Another characteristic to be controlled is the stabilization of the alumina slurry so as to avoid the particles from settling down. Nijhuis et al. [41] suggested that addition of some acid to shift pH between 3 and 4 improved the slurry stabilization. Furthermore, the addition of acetic acid up to 2.5 mol l-1 (pH=2.6) decreased considerably the viscosity of the slurry, permitting the use of concentrated Al2O3 slurries without penalization in the layer homogeneity [47].
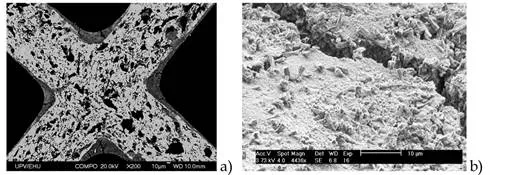
Fig. 3 shows the characterization of a washcoated monolith with scanning electron microscopy (SEM). The washcoating procedure was carried out by immersion of the monolith into alumina slurry with the following characteristics: 20 wt % Al2O3, mean diameter of 1 µm and 2.5 mol l-1 of acetic acid. Eight immersions of the monolith were needed to achieve around 400 mg of Al2O3 over the monolithic substrate (D=L=2 cm). Fig. 3a shows a lower magnification image where the intersection of different channels of the monolith can be observed. As it can be clearly noticed, the original structure of the cordierite was completely covered with alumina. The deposition is preferential in the corners of the channels whereas far away from this position, the alumina layer has a constant thickness of 5 µm. Fig. 3b shows a higher magnification image where a crack in the alumina layer is observed. This image also confirms that the alumina layer was composed of particles around 1 µm in size.
The next step in the catalyst preparation is the incorporation of the active phases. As already mentioned, NSR catalysts are usually composed of an alkali or alkali-earth oxide and a noble metal deposited onto the alumina. The most common metal used for NSR catalyst formulation is Pt, whereas BaO is normally used as the storage component [34-36]. The order of the incorporation steps of the active phases Pt and Ba is crucial, especially when operating at higher temperatures; a higher storage capacity is obtained when impregnating Pt/Al2O3 with Ba than when impregnating Ba/Al2O3 with Pt, increasing the storage value as much as 54 % when adding Ba in the last step [51].
Platinum was incorporated following two different procedures, conventional wetness impregnation (1 monolith) and adsorption from solution (3 monoliths). For the conventional procedure, the channels of the monolith were filled with an aqueous solution containing the desired amount of Pt, using Pt(NH3)4(NO3)2 as a precursor [52]. Then, liquid was evaporated at 80 °C and finally the monolith was calcined at 500 ºC for 4 h. On the other hand, in the adsorption from solution procedure, the monoliths were immersed in an aqueous solution with the adequate concentration of Pt. The pH of the solution was turned basic (11.9) in order to generate an electrostatic attraction between the alumina surface, positively charged, and the Pt precursor, negatively charged Pt(NH3)42+ [53-55]. The monoliths were maintained immersed in the solution for 24 h so as to reach the adsorption equilibrium. Then, the monoliths were removed from the solution, the excess of liquid blown out and finally the monoliths were calcined at 450, 500 and 550 ºC, respectively. The four prepared monolith catalysts were tested for their performance in the NSR process.
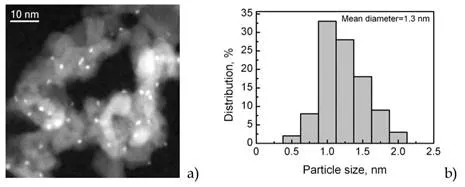
Irrespective of the calcination temperature, the monolith prepared by wetness impregnation showed the lowest dispersion of platinum (15 %). In the rest of the samples, platinum dispersion decreased as the calcination temperature increased, from 54 % at 450 ºC to 46 % at 500 ºC and finally to 19 % at 550 ºC. Then, 500 ºC was chosen as the optimal calcination temperature as a good compromise between platinum dispersion and thermal stabilization of the catalyst. Fig. 4b shows the platinum particle size distribution determined from the transmission electron microscopy image (Fig. 4a) for a Pt/Al2O3sample prepared by adsorption from solution and calcined at 500 ºC. As it can be observed, the Pt particles are fairly dispersed over the alumina washcoat with a mean particle size of 1.3 nm.
The last step in the NSR catalyst preparation is the incorporation of the NOx storage component, i.e. barium. The precursor used was barium acetate [52] and two different procedures were followed: wetness impregnation and incipient wetness impregnation (also known as dry impregnation). For wetness impregnation, the monolith channels were filled with an aqueous solution containing the desired amount of barium. Then, the monolith was dried and calcined. Alternatively, for incipient wetness impregnation, the monolith was immersed in an aqueous solution with an adequate concentration of barium acetate for a few seconds; then, the monolith was removed and the liquid in the channels was blown out with compressed air. Thus only the liquid retained in the pores of the alumina remained in the monolith. In order to determine the distribution of Ba in the catalyst, the monolith was divided into 8 pieces and the content of barium was determined by inductively coupled plasma mass spectrosmetry (ICP-MS). It was found that the distribution of barium resulted in an egg-shell type for wetness impregnation, whereas the incorporation of Ba by incipient wetness impregnation led to more homogenous distribution. Table 3 resumes the preparation procedure, the catalyst physico-chemical characteristics and the NOx storage achieved with the prepared catalysts (A, B, C and D).
The activity of the prepared catalysts was tested in a vertical downstream reactor with a feedstream composed of 380 ppm NO and 6 % O2 during the lean period (150 s) and 380 ppm NO and 2.3 % H2during the rich period (20 s) using nitrogen as the balance gas in both cases. The total flowrate was 3365 ml min-1 that corresponds to a gas hourly space velocity (GHSV) of 32,100 h-1. Fig. 5 shows the NOx concentration profile at the reactor exit for A, B, C and D catalysts. As it can be observed, the NOxconcentration profile is always below the inlet value (380 ppm NO) which evidences the activity of the prepared catalysts for the storage of NOx. During the storage-reduction cycles, the typical NOxconcentration profile was recorded [56,57]. At the beginning of the lean period practically all the NOxis stored, and consequently its concentration at the reactor exit is very low. Then, as the lean period time increases, the storage sites become saturated and the NOx concentration at the reactor exit gradually increases. During the rich period, the NOx stored are released and reduced with the injected hydrogen, leaving the catalyst surface clean for the subsequent storage period.
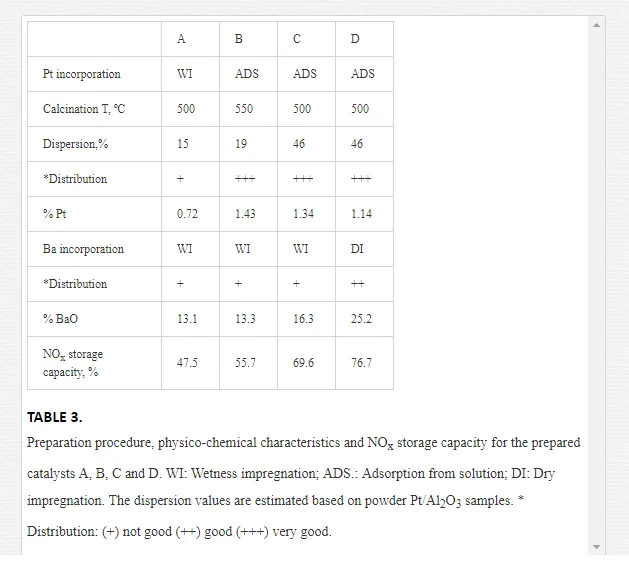
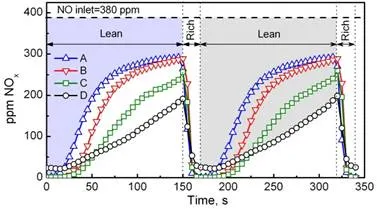
The NOx storage capacity is related with the area between the NO inlet level and the NOx outlet concentration profile; the lower NOx concentration at the reactor outlet the higher activity of the catalyst for the storage of NOx. Thus, among the prepared catalysts, catalyst D was found to be the most active (gray area on the rigth graph) and catalyst A (blue area on the left graph). Quantification of the NOx storage capacity can be found in Table 3 with the following order from the least to the most active: A<B<C<D, according to the physico-chemical characteristics of the samples. It is well known that the Pt-Ba pair is the responsible for the storage of NOx and that proximity between both metals is beneficial for the process [47,58,59]. Consequently, catalyst A resulted in the less active sample due to the low platinum dispersion and non-homogeneous distribution of both Pt and Ba, as it was prepared by conventional wetness impregnation (WI) of Pt and Ba. For catalyst B, the incorporation of Pt by adsorption from solution (ADS) increased Pt dispersion, but just slightly as the higher calcination temperature (550 ºC) also provokes some platinum sintering. Higher Pt loading and dispersion were identified as responsible for better storage capacity, from catalyst A (47.5 %) to catalyst B (55.7 %). The lower calcination temperature (500 ºC) for catalyst C provided much higher dispersion, thus enhancing the NOx storage capacity up to 69.6 %. Furthermore, the incorporation of Ba by dry impregnation (DI) in catalyst D provided a better distribution of barium over the monolith and consequently increased the Pt-Ba proximity resulting in the best storage capacity (76.7 %), i.e. 76.7 % of NO at the inlet was trapped in the catalyst.
The chemistry of NOx storage and reduction
Many studies are available in the technical literature dealing with the storage step of NSR catalysts. Particularly relevant in this field is research by Forzatti et al. [60-65] and Fridell et al. [66-68]. In situ FTIR spectroscopy has been found to be a very useful tool and several studies have been made on adsorbed NOx species, though the assignment of peaks is still under debate. Takahashi et al. [27] were pioneers in studying the interaction of NOx over NSR catalysts and assigned the 1350 cm-1 peak to the nitrate anion. Fig. 6a shows the FTIR spectra of Pt-Ba/Al2O3 sample after it was exposed during 20 minutes to a feedstream composed of 440 ppm NO and 7 % O2 using N2 as the balance gas. As it can be observed, the FTIR spectra changed very significantly with the operating temperature. Bridged nitrites situated at 1220 cm-1 [66] were dominant when the adsorption was carried out below 250 ºC, whereas the dominant species became ionic nitrates (asymmetric and symmetric modes of monodentate nitrates) located at 1332 and 1414 cm-1 [69] for temperatures above 250 ºC. This shift in the adsorption mode from nitrites to nitrates with temperature had been already reported in the literature [62,63,66,67,70].
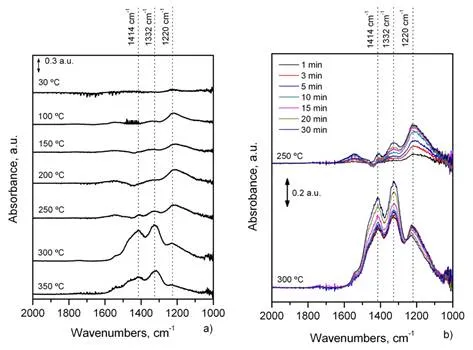
All spectra included in Fig. 6a were recorded after the sample had been exposed to the lean gas mixture for 20 min. However, it can be interesting to examine the evolution of adsorbed species with increasing contact time. Owing to the fact that the adsorption mode of NOx changed from nitrites at 250 ºC to nitrates at 300 ºC, several FTIR spectra were recorded at different contact times for those temperatures. The first spectrum was recorded after the sample had been exposed to the lean gas mixture for 1 min while the last one was taken after 30 min. As revealed by Fig. 6b, when the adsorption was carried out at 250 ºC nitrite was immediately formed upon admission of NO, whereas nitrate formation was delayed. Furthermore, the intensity of the peaks corresponding to nitrite (1220 cm-1) and nitrate (1322, 1414 cm-1) increased nearly in the same extent with increasing contact time, which means that there was no conversion from nitrites to nitrates or that conversion from nitrites to nitrates and formation of additional nitrite species occurred simultaneously. In short, below 250 ºC nitrite was the dominant adsorption species even at contact times of 30 min, which is much longer than in real operation (1-2 min).
On the other hand, the adsorption pattern resulted completely different at 300 ºC (Fig. 6b). From the beginning of the adsorption, the intensity of the bands assigned to ionic nitrates was higher than nitrite. Moreover, it can be noticed that the adsorption peak assigned to nitrites resulted maximum in the first minute of storage and then gradually decreased till minimum after 30 min of contact time. Thus, it can be concluded that there is a shift from nitrite to nitrate when increasing contact time which can be associated with the oxidation of nitrites to nitrates under the lean gas mixture.
In early ages of NSR catalysts, Fridell et al. [66] proposed a three step mechanism in which NO2 is at first loosely adsorbed on BaO as a BaO-NO2 species; this species then decomposes to BaO2 and NO (which is released in the gas phase) and finally barium peroxide reacts with the gas-phase NO2 to give barium nitrate which can be illustrated as:
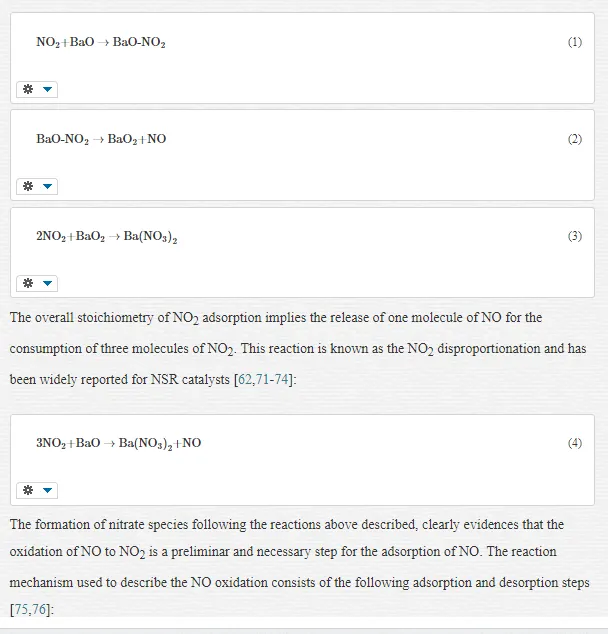
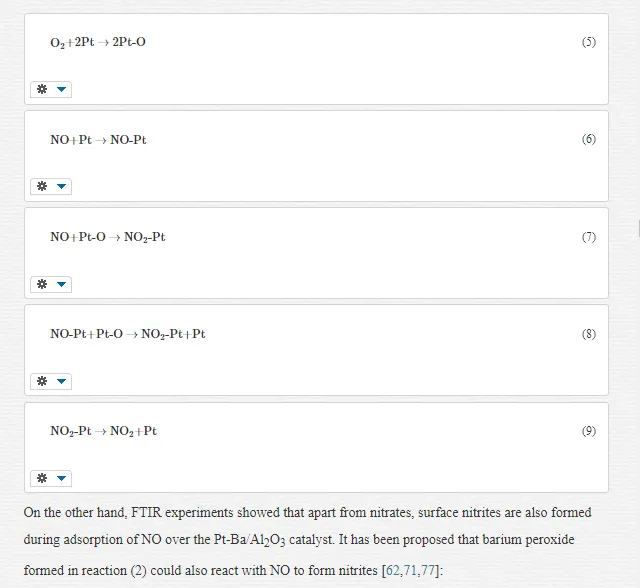
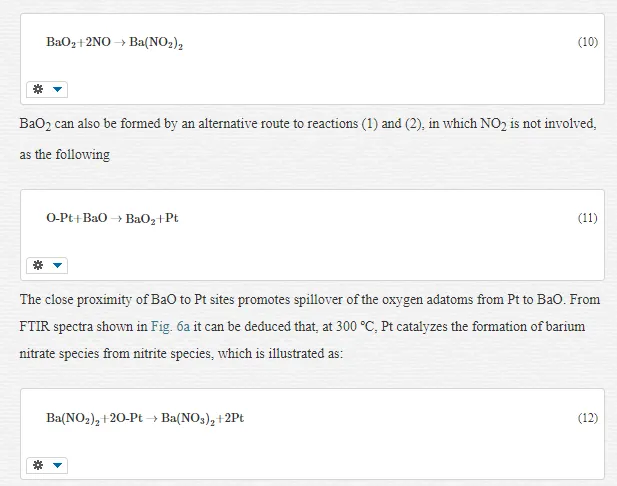
Thus, from the experiments shown in Fig. 6, two parallel routes can be described for the adsorption of NOx, which are in concordance with the most accepted mechanism by Forzatti et al. [65]. The first route is called “nitrite route” where NO is oxidized at Pt sites and directly stored onto Ba neighbouring sites in the form of nitrite ad-species (reaction 10), which can be progressively transformed into nitrates depending on reaction temperature (reaction 12). The second route is called “nitrate route” which implies the oxidation of NO to NO2 on Pt sites, followed by NO2 desproportionation on Ba sites to form nitrates with the giving off NO into the gas phase (reaction 4).
The regeneration step of NSR catalysts is not so well understood as the storage step. Several studies have been published on the chemistry and mechanisms that rule the reduction of NOx ad-species by H2. The nitrite and nitrate decomposition can be driven by either the heat generated from the reducing switch [78,79], or the decrease in oxygen concentration that lowers the equilibrium stability of nitrates [34,80]. However, under near isothermal conditions, it has been found that the reduction process is not initiated by the thermal decomposition of the stored nitrates, but rather by a catalytic pathway involving Pt [45]. The reduction of stored nitrates and nitrites leads to the formation of different nitrogen containing species, such as N2, NH3 and N2O along with H2O. The objective of the NSR operation is to maximize the conversion of NO into N2, avoiding the formation of NH3 and N2O as far as possible. The operational conditions to run efficiently the NSR process are discussed in detail in section 5.
Fig. 7 shows the concentration profiles of NO, NO2, NH3, N2O and H2O, and the evolution of the MS-signal for N2, O2 and H2 during the regeneration step when the reaction was carried out at 330 ºC. The feedstream composition during the lean period was 975 ppm NO, 6 % O2 and Ar to balance, extending the length of this period until complete saturation of the catalyst was obtained. Afterwards, during the rich period, oxygen was replaced by 0.6 % H2 for 500 s. As can be observed in Fig. 7, before the regeneration period started the sum of NO and NO2 concentration was close to the inlet value (975 ppm), confirming that the catalyst was saturated. The presence of NO2 at the reactor exit is due to the oxidation of NO by Pt sites as described in eqns. (5)-(9). When the rich feedstream contacts the catalyst (t=0), the NO and NO2 concentrations are progressively reduced, eventually reaching 0 ppm. At the very beginning of the rich period a sudden increase in the NO and NO2 concentrations can be observed due to the release of adsorbed NOx as a consequence of the decrease in oxygen partial pressure that reduces the stability of the stored nitrates and nitrites. Meanwhile, the incoming H2 reacts with adsorbed NOx to form N2, NH3 and N2O. As can be observed in Fig. 7, the formation of N2 and N2O is detected immediately after the reduction period started, whereas the detection of H2O and NH3 was delayed, the later in a much more extent. On the other hand, the complete consumption of H2 during the initial period of the regeneration together with the rectangular shape of the H2O and N2 formation curve indicates a “plug-flow” type of the regeneration mechanism. As several authors have already reported [45,78,81,82], the hydrogen front travels through the catalyst bed with complete regeneration of the trapping sites as it propagates down the bed with regeneration time. After the required time, complete regeneration of the trap is obtained, i.e. no nitrates or nitrites are present in the catalyst surface, and consequently H2 is detected at the reactor outlet.
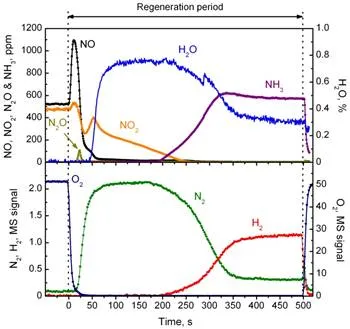
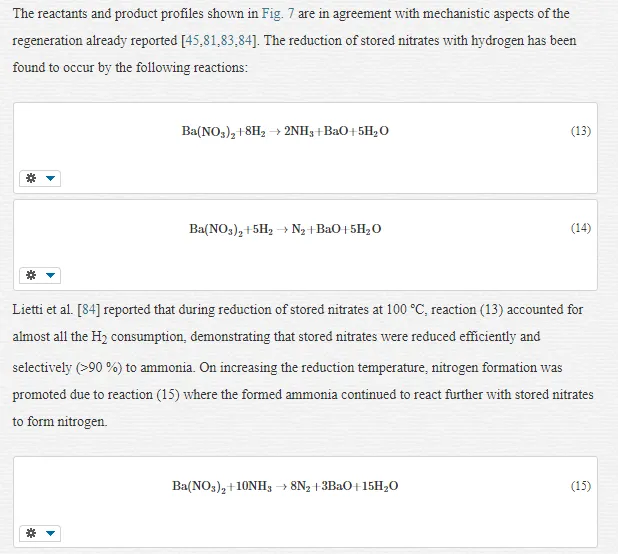
Thus, nitrogen formation involves a two-step pathway: the fast formation of ammonia by reaction of nitrates with H2 (reaction 13) and the subsequent conversion of the ammonia formed with stored nitrates leading to the selective formation of N2 (reaction 15). This overall mechanism for nitrates reduction during LNT regeneration has been confirmed by Pereda-Ayo [85] using isotope labelling techniques and explains the evolution of products at the reactor exit shown in Fig. 7. When the hydrogen front enters the catalyst, the stored NOx are thought to be converted mainly to ammonia, with total H2 consumption. Then, the ammonia formed in the regeneration front reacts further with stored nitrates located downstream to give nitrogen. Thus, N2 is detected as soon as the regeneration period starts, but no ammonia can be detected since it was completely consumed. As the regeneration time increases and the hydrogen front moves forward, the ammonia formed has fewer nitrates to react with, and therefore some NH3 starts to leave the catalyst unreacted, being detected at the reactor outlet.
Analysis of engineering variables of the NSR process
The importance of the catalyst properties, chemical composition, structure, morphology and, in special dispersion and distribution of the metallic phases on its behavior in storing and reducing NOx has been well reviewed in the work of Roy and Baiker [35]. Generally, research in the scientific open literature has studied independently the two stages, storage and reduction, to advance in the understanding of the mechanisms that happen in each stage. Up to now many papers on the stage of storage have been published [e.g. 60,63,66-68,70,72,87], but notably less on the stage of regeneration (liberation and reduction) [e.g. 39,81,86,88,89]. However, very few studies have considered the whole operation, where the lean and rich periods occur successively as in the real application.
In fact, still scarce relations have been proposed between storage, regeneration and product distribution as determined in laboratory, and the optimization of the conditions in which the catalytic converter should operate in automobiles. It must be mentioned that engineering parameters, such as gas hourly spatial velocity (GHSV), residence time in the converter, and the lasting time of the periods of storage and regeneration, influence significantly the behavior of lean NOx traps (LNTs). Kabin et al. [90] studied the storage and reduction of NOx on model monolithic Pt-BaO/Al2O3 catalysts to relate the percentage of the NOx trapped during storage (trapping efficiency) and the reduced NOx percentage (average NOx conversion) with the load of Ba (6-25 %) and the GHSV (30,000-120,000 h-1). These authors concluded that the dependence of trapping efficiency on the storage period duration provides a good estimation of the time needed to get a given average conversion during the whole NSR process. More recently, Clayton et al. [91] determined the effects of the catalyst temperature, the composition of the rich stream (NO, H2, O2), duration of lean and rich periods and the H2/NO ratio on the average conversion and product selectivity of a commercial Pt-BaO/Al2O3 catalyst. The NOx average conversion resulted maximum at 300 ºC, and also the trapping efficiency resulted maximum at the same temperature. The selectivity to N2 exhibited a maximum at slightly superior temperature, where the selectivity to NH 3 was minimized.
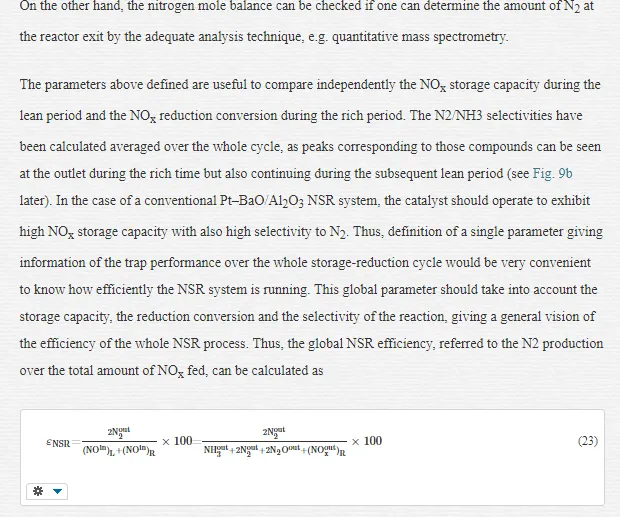
Thus, to define the optimal operation in the NSR technology, the efficiency of both the storage and reduction steps but also the global NSR efficiency must be studied. This section is devoted to set a definition for the global NSR efficiency of the process, obviously related to the catalyst behavior, the NOx storage and reduction mechanisms, and the kinetics of the release and reduction of NOx during the regeneration phase. The defined parameter must account the byproduct formation to maximize the NOxreduction efficiency towards N2. The process selectivity depends notably on the lean and rich period duration. For this purpose, experimental runs have been carried out with storage period duration in the order of minutes, followed by rich injection periods during some seconds. The effect of the lean and rich period duration and the reductant concentration should be analyzed, stating as objective functions for optimization the storage capacity in the lean period, the NOx conversion in the rich period, and the selectivity towards N2O/NH3/N2. Also a bidimensional analysis of operational variables, including temperature and hydrogen concentration, will be made in this section.
The experiments were carried out with a homemade 1.2 % Pt-15 % BaO/Al2O3 monolith catalyst, prepared as explained in section 3 [1,47]. Each time some operational variable was altered, at least ten successive lean-rich cycles were proceeded in order to assure a new stable state of the system, and then the performance was monitored.
DEFINITION OF RESPONSE PARAMETERS
To evaluate the performance of the catalyst during the lean and rich periods the NOx storage capacity, NOx conversion and N2/NH3 selectivities have been determined from the concentration curves at the reactor exit monitored during the experimental storage-reduction cycles.
The total NOx stored during the lean period, was calculated as
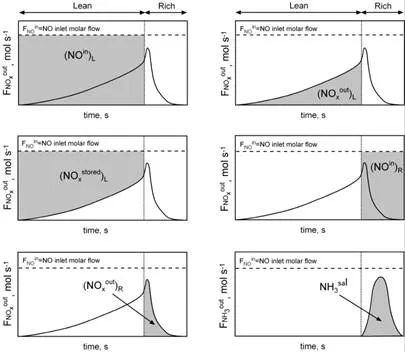
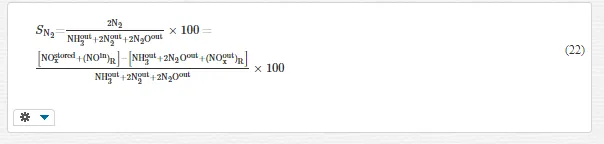
OPTIMAL CONTROL OF THE NSR TECHNOLOGY BY MANAGING THE AMOUNT OF REDUCTANT INJECTED DURING THE REGENERATION PERIOD
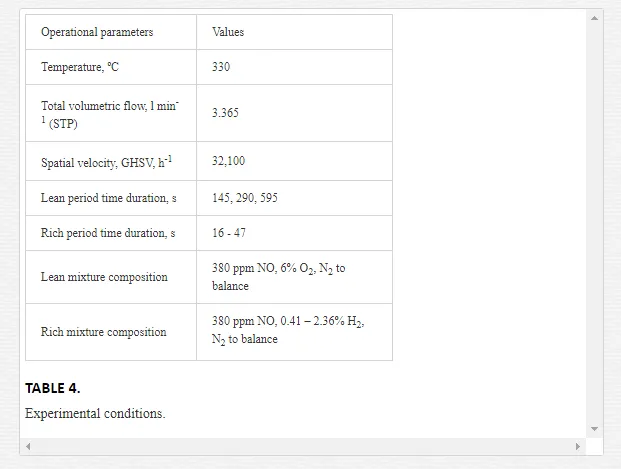
NOx storage-reduction experiments were carried out in a downflow steel reactor. The monolithic catalyst (25 mm in length and diameter, 3.5 g) was placed in the bottom part of the reactor and the set was introduced in a 3-zone oven. The temperature at the entry and exit of the reactor was continuously monitored. The experimental conditions are shown in Table 4. The feedstream during storage was 380 ppm NO/6 % O2/N2. Gases were fed through mass controllers with a total volumetric flow of 3,365 l min-1, corresponding to a GHSV of 32,000 h-1 (STP).
The problem was stated as follows: to find the values of the operational variables, including lasting time of the storage period (lean mixture), lasting time of the regeneration period (rich mixture) and hydrogen concentration injected during the regeneration period, which allow to achieve the maximum NSR efficiency (Eq. 23).
EFFECT OF THE H2 CONCENTRATION IN THE REGENERATION STREAM ON NOXSTORAGE AND REDUCTION
Fig. 9 shows the effect of hydrogen concentration in the rich stream on the NOx and NH3concentrations at the exit of the reactor, for experiments carried out at 330 ºC. During the lean period the stream composition was 6 % O2 and 380 ppm NO, with N2 to balance. After 145 s of lean period the oxygen was shifted to hydrogen at different concentrations (0.79, 1.1 and 2.32 %), maintaining 380 ppm NO in the feedstream for the regeneration period of 25 s.
The evolution of NOx concentration at the reactor exit during the storage and regeneration periods is that typical for the NSR process (see Fig. 2), i.e. at the beginning of the lean period all amount of NOxis stored, and this amount is gradually reduced as the adsorption sites are being saturated, then increasing the NOx exiting the reactor. It can be seen in Fig. 9a, nevertheless, that the NOxconcentration at the end of the lean period (145 s) did not reach the initial concentration (380 ppm NO), i.e. the catalyst was not completely saturated. The monitored values resulted in 240, 170 and 145 ppm NOx for runs 1, 2 and 3, respectively.
After 145 s of lean period, the shifting of oxygen by hydrogen to the entry of the reactor provokes the release of the previously stored NOx which is eventually reduced to N2O, NH3 and N2, according to the mechanisms explained in section 4. The evolution of ammonia concentration at the reactor exit is shown in Fig. 9b. At 330ºC, however, N2O was not practically apreciated at the reactor exit.
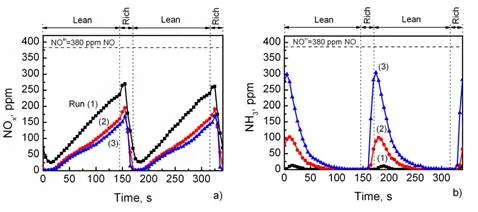
The hydrogen concentration influences significantly the formation of ammonia at the exit, from 15 ppm NH3 for 0.79 % H2 to a maximum of 300 ppm NH3 for 2.32 % H2. In fact, the higher H2 concentration in the reduction stream the higher NH3 concentration at the exit, as previously reported [56,78,87-89,91]. These experiments also confirmed the delay in the ammonia detection at the reactor exit related to the beginning of the rich period, as it was observed in the experiments of section 3.
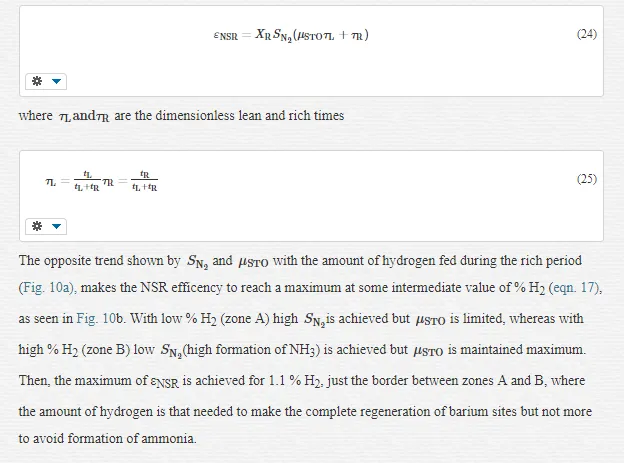
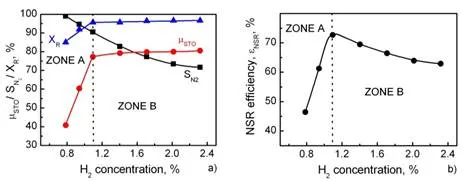
The amount of hydrogen supplied during the rich period also influences the storage capacity and distribution of products. In fact, the storage capacity (μSTO,eqn.17)(μSTO,eqn.17) increased with H2 concentration, resulting in 40.8, 77.3 y 80.5 % for runs 1, 2 and 3, respectively. Similarly, selectivity to NH3 (SNH3SNH3, eqn. 19) also increased with H2 concentration, resulting in 2, 10 and 29 %, respectively. This influence can be better observed in Fig. 10, where values of the response variables corresponding to additional H2concentration experiments have been included. The response variables calculated have been: storage capacity (µSTO, eqn. 17), NOx reduction conversion (XR, eqn. 18), selectivity to N2 (SN2SN2, eqn. 22) and NSR efficiency (εNSR,eqn.23)(εNSR,eqn.23).
Fig. 10a evidences a linear increase of the storage capacity (red line) with H2 concentration up to 1.1 %. Above 1.1 % H2, the storage capacity was maintained almost constant in about 80 %. This evolution can be explained from the regeneration mechanism proposed in section 4 [84,85]. During the regeneration step there exits a hydrogen front that travels along the catalyst while regenerating the adsorption sites. If the amount of hydrogen fed is enough, the regeneration front will travel until regeneration of the complete trap. On the contrary, if the reductant is in defect, the regeneration front will not arrive to the final part of the reactor, and the adsorption sites downstream could not be regenerated. This explains that 0.79 % H2 was not able to regenerate the whole catalyst resulting in a limited storage capacity (40.8 %). While increasing the H2 concentration, the regeneration front was able to reach more advanced positions and thus regenerates more adsorption sites, resulting in higher storage capacity during the lean period. Above 1.1 % H2 it is assumed that the regeneration front travels the whole catalyst with total regeneration of the trap. Thus, higher H2 concentration did not produce significant variations of the storage capacity. Another explanation was supplied by Clayton et al. [86] based on the different storage regions related to the barium phase storage sites based on their proximity to Pt crystallites. They associated the extension of these regions with the platinum dispersion and the reaction temperature.
The reduction conversion (blue line) follows a similar trend to the storage capacity (Fig. 10a). Hydrogen concentration above 1.1 % resulted in almost total conversion (97 %), whereas lower concentrations resulted also in lower conversion level. In fact, when the supply of H2 is not enough to allow the hydrogen front achieving the complete regeneration of the trap, e.g. 0.79 % H2, the NOxreduced/NOx released ratio is increasing, then decreasing the NOx reduction conversion to 85 %.
Concerning selectivity N2/NH3 (remember that N2O concentration was negligible at 330 ºC), Fig. 10ashows that formation of ammonia decreased with lower hydrogen concentration during the rich period, being very low with 0.79 % H2. Thus, when the catalyst regeneration was carried out under low hydrogen concentration (0.79 % H2) the selectivity to N2 is practically total and only 15 ppm NH3 were detected. When increasing the H2 concentration, the selectivity to N2 decreased progressively in favour of ammonia (Fig. 9b). This agrees with the observation of Clayton et al. [91] that nitrogen selectivity increased with the NOx/H2 ratio.
The trends of NOx storage capacity, NOx conversion and N2/NH3 selectivity above explained, suggest differentiation of two different zones in Fig. 10, limited to each other by 1.1 % H2. In zone A occurs that hydrogen is the reactant that limits the reduction of NOx, and complete NOx reduction cannot be achieved (Fig. 8, 0.79 % H2). On the contrary, in zone B the reaction occurs with excess of hydrogen and NOx are completely reduced. This is also in agreement with the fact that in zone A the NOx storage capacity is limited as all barium sites cannot be regenerated, whereas in zone B the excess of hydrogen enhances the ammonia formation.
Fig. 10b shows the evaluation of NSR efficiency (εNSRεNSR) with H2 concentration. As already mentioned, this can be considered as a global parameter that considers the complete storage-reduction cycle as determining the molar amount of nitrogen at the reactor exit over the molar amount of NO at the entry, expressed as percentage. In fact, with some simple mathematical rearrangements of eqns. (17)-(23), the relationship between the NSR efficiency and the previous response variables can be found, which is expressed as:
INFLUENCE OF STORAGE AND REGENERATION PERIOD DURATION ON THE NOXSTORAGE AND REDUCTION
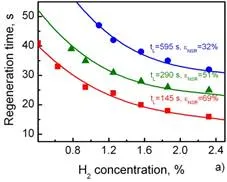
In the previous section all experiments were performed with same duration of the lean and rich periods, i.e. tL=145 s and tR=25 s, and varying only the H2 concentration during the rich period. On the other hand, it can be concluded that the total amount of hydrogen fed during the rich period determines the maximum NSR efficiency. Obviously this amount of hydrogen can be considered proportional to the product CH2×tRCH2×tR, so that it can also be varied by modifying the duration of the rich period. Pereda–Ayo et al. [56] made experiments looking for different combinations of pairs (CH2,tR)(CH2,tR)that achieved maximum NSR efficiency, when the lean period duration was maintained in 145 s. The results of these experiments can be represented as the locus of all these combinations as shown in Fig. 11 (tL=145 s, red curve) and defines the isocurve of operational conditions to carry out the global NSR process efficiently.
The shape of the isocurve represented in Fig. 11 indicates the inverse relationship between the regeneration time and the reductant concentration to achieve an efficient NSR process, i.e. the shorter reduction time, the higher reductant concentration needed to achieve maximum efficiency. This finding implies again that the supply of the reductant H2 is controlling the NSR process. This was also observed by Mulla et al. [81] that measured the time required for regenerate the trap catalyst by the width of the N2 pulse in a mass spectrometer. Analogously, Nova et al. [45] had also noticed that the N2 production during the regeneration of a Pt–BaO/Al2O3 catalyst was limited by the amount of H2 fed to the reactor.
EXTENSION OF THE DURATION OF LEAN PERIOD ON THE NSR PERFORMANCE
To further investigate the optimal conditions to operate the NSR process efficiently, the duration of the storage period was varied, extending the lean period duration from 145 to 290 and 595 s [56]. Again, analogous NOx storage and reduction experiments were performed with those extended times and the same protocol as before. It has been verified that the same storage capacity was obtained for a given lean period duration, resulting in additional isocurves shown in Fig. 11. As expected, the NOx storage capacity decreased as the lean period duration increased. When the lean period is longer the catalyst is closer to the saturation level, and consequently the NOx storage capacity decreases, i.e. 77, 55 and 35 % for tL = 145, 290 and 595 s, respectively. As for selectivity to nitrogen, very similar values were found around 90 %, irrespective of the studied variables (CH2,tR,tL)(CH2,tR,tL), provided that the operation is achieved with maximum efficiency (all points in every isocurve in Fig. 11).
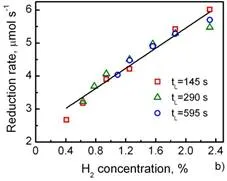
As noted above, the nitrogen production during the regeneration of the catalyst is limited by the amount of hydrogen fed to the reactor. Likewise, increasing the hydrogen supply rate is expected to have a linear effect on the overall rate of NOx reduction. For our experiments, Fig. 12 shows a linear effect of the hydrogen concentration fed during the rich period on the overall NOx reduction rate, independent of the duration of the lean period, thus suggesting again that the regeneration step is limited by the amount of hydrogen fed. The linear relationship implies that the time required for complete regeneration should be inversely proportional to the reductant amount of hydrogen fed, as shown in the isocurves of Fig. 11. Mulla et al. [81] also reported the overall rate for NOx reduction as a linear function of rate of flow of H-atoms in the form of H2 or NH3 at 300 ºC. Their observations also confirmed that the regeneration process was not mass transfer or kinetically limited, but it was controlled by the supply of the reductant H2.
Finally, the term “operation map” is suggested for the set of curves represented in Fig. 11, as a tool for finding any combination of the three studied operational variables: the duration of the lean period, the duration of the rich period and the concentration of the reducing agent: to run the NSR process efficiently. Two ideas may arise from this map. First, every manufactured catalyst can be associated with its own map, so that the comparison of maps will provide information about their relative efficiency when running under the real application. Secondly, one may wonder if any operation point in the map of Fig. 11 is susceptible to be chosen as the best combination (CH2,tR,tL)(CH2,tR,tL)to run in real application.
PERFORMANCE OF NOX STORAGE–REDUCTION CATALYST IN THE TEMPERATURE–REDUCTANT CONCENTRATION DOMAIN BY RESPONSE SURFACE METHODOLOGY
All previous experiments were carried out at the temperature of 330 ºC, at which N2O at the reactor exit was negligible, thus being selectivity distributed between N2 and NH3, depending on the lean and rich period durations and the hydrogen concentration during the rich period. In this section, the NSR performance trends of the Pt–Ba/Al2O3 monolith catalyst will be studied at different temperatures and varying the hydrogen concentration fed during the regeneration period by the response surface methodology (RSM). The NOx storage and reduction behaviour was tested over 9 levels of temperature: 100, 140, 180, 220, 260, 300, 340, 380 and 420 ºC and 9 levels of hydrogen concentration: 0.4, 0.55, 0.7, 0.85, 1, 1.5, 2, 2.5 and 3 % [57].
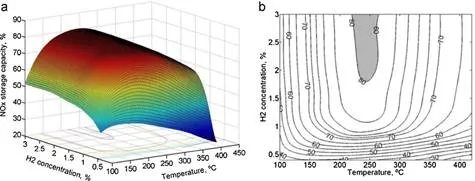
Fig. 13a shows the NOx storage capacity (μSTOμSTO) response surface in the hydrogen concentration and reactor inlet temperature domain. With the aim of finding the optimal region, isocurves corresponding to different levels of μSTOμSTO projected to the T−CH2T−CH2space are drawn in Fig. 13b. In the region comprised between temperatures of 220 and 260 ºC and hydrogen concentrations of 1.75 and 3 % a nearly flat surface corresponding to the maximum NOx storage capacity above 80 % is observed (shaded region). These optimal operational conditions correspond to intermediate temperature and excess of hydrogen. At lower temperatures the conversion of NO to NO2 was not favoured whereas at higher temperatures the stability of the stored nitrates was reduced leading in both cases to a decrease in the NOx storage capacity [85]. On the other hand, operating with low hydrogen concentration (<1 % H2) resulted also in a sharp decrease in the NOx storage capacity due to the incomplete regeneration of the catalyst [56].
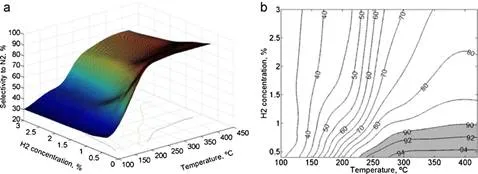
Likewise, Fig. 14a shows the selectivity to nitrogen response surface in the hydrogen concentration and temperature domain and Fig. 14b the projected iso-selectivity to nitrogen curves. At low temperature (<150 ºC) the selectivity to nitrogen resulted nearly independent of the hydrogen concentration as almost vertical lines can be observed. In this region, the product selectivity changed from N2O at low H2 concentrations to NH3 at higher ones, but remaining practically constant the selectivity to nitrogen. For example, at 100 ºC, N2O/NH3/N2 = 54.5/5.1/40.4 for 0.4 % H2; N2O/NH3/N2 = 34.7/33.1/33.2 for 1 % H2; N2O/NH3/N2 = 19.5/48.8/31.7 for 3 % H2. For higher temperatures (>180 ºC), where the formation of N2O was negligible, the influence of hydrogen concentration on the selectivity to nitrogen became markedly significant. In this region, the higher hydrogen concentration the lower nitrogen selectivity, and therefore the higher ammonia, was obtained. For example, at 340 ºC, N2O/NH3/N2 = 3.4/2.2/94.5 for 0.4 % H2; N2O/NH3/N2 = 0.8/9.4/89.9 for 1 % H2; N2O/NH3/N2 = 0.6/25.0/74.4 for 3 % H2.
The optimal operational window which resulted in a selectivity to nitrogen higher than 90 % was situated at intermediate-high temperatures (T >250 ºC) and low hydrogen concentrations (CH2CH2 < 1 %) as it can be seen in Fig. 14b (shaded region).
The optimal operating region for maximizing NOx trapping efficiency and nitrogen selectivity, Fig. 13b and 14b, respectively, did not intercept to each other. The first was maximum at intermediate temperatures and high H2 concentrations, T = 220–260 ºC and CH2 = 1.75–3 % H2; whereas the selectivity to nitrogen was favoured by high temperatures and low H2 concentrations, T > 250 ºC and CH2CH2 < 1 %.
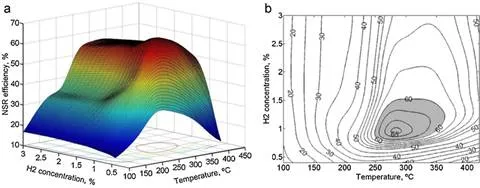
In conventional NSR systems NOx conversion towards N2 should be maximized while NH3 formation should be avoided. The percentage of NOx converted into nitrogen relative to the total amount of NO entering the trap has been defined as global NSR efficiency (εNSRεNSR, eqn. 23), which allows one to look for the optimal combination of reactor inlet temperature and hydrogen concentration during rich period to obtain the most efficient NSR operation. Fig. 15a shows the εNSRεNSR surface response in the hydrogen concentration and temperature domain and Fig. 15b the projected iso-efficiency curves. As it could be expected, an optimal interval of temperature and hydrogen concentration situated between the optimal operational conditions to obtain maximum storage and maximum selectivity was found. The NSR efficiency resulted higher than 60 %, that is, more than 60 % of NO entering the trap was converted into nitrogen, in the following operating window: T = 250–350 ºC and CH2CH2 = 0.8–1.5. This region provides the best compromise between NOx storage capacity and selectivity to N2 to maximize the nitrogen production at the reactor exit related to the total amount of NO at the reactor inlet. The most efficient operation corresponds to 0.9 % H2 and 280 ºC reaching 65 % of global NSR efficiency (Fig. 15b).
Conclusions
The NOx storage and reduction technology for diesel eshaust aftertreatment has been studied in the present chapter, including the synthesis of Pt-BaO/Al2O3 monolith catalyst, the involved reaction mechanisms or chemistry of the process, and the control of engineering parameters, of importance in the real application in automobiles, to remove nitrogen oxides most efficiently by conversion to nitrogen.
The preparation methodology for Pt-BaO/Al2O3 monolith catalyst has been described. The monolith is primarily washcoated with a thin film of porous alumina. Then platinum is incorporated by adsorption (ion exchange) from a Pt(NH3)4(NO3)2 aqueous solution. Finally, the barium as NOx storage component is incorporated by dry impregnation from a Ba(CH3-COO)2 aqueous solution. This procedure achieves homogeneous distribution as well as high dispersion of platinum and barium on the catalyst surface, then providing the adequate Pt-Ba proximity which enhances the interaction needed for Pt to promote both the initial NO oxidation and the reduction of NxOy adspecies on the Ba sites.
The chemistry of NOx regeneration and reduction mechanisms has been reviewed. Operando FTIR experiments of NOx adsorption on powder Pt-Ba/Al2O3 samples has shown that below 250 ºC nitrite species are predominant whereas above 250 ºC nitrate species are predominant. Thus, two parallel routes have been verified. The ″nitrite route″ where NO is oxidized on Pt sites and stored onto Ba neighbouring sites in the form of nitrite ad-species which can progressively transform into nitrates depending on the reaction temperature. The second route, called ″nitrate route″ implies the oxidation of NO to NO2 on Pt, then NO2 desproportionation on Ba to form nitrates NO evolved into the gas phase.
During the regeneration period, when oxygen is shifted by hydrogen, the reduction of stored nitrites and nitrates leads to the formation of different nitrogen containing species, namely N2, N2O and NH3 along with water. Nitrogen formation involves first the fast formation of ammonia by reaction of nitrates with H2 and then the subsequent conversion of the ammonia formed with stored nitrates leading to the selective formation of N2. At temperature above 330 ºC, N2O was almost negligible.
In the automobile practice, the operational conditions at which the process is conducted affect significantly the NSR behaviour of a Pt-BaO/Al2O3 monolith catalyst, such as the duration of lean and rich periods and the concentration of reductant fed during the regeneration period. There exists a given amount of hydrogen which is needed to achieve the complete reduction of NOx (stored during the lean period and fed during the rich period). Below that minimum, as regeneration is not complete the reduction conversion is lower and consequently the storage capacity in the subsequent lean period is also reduced. However, with hydrogen in defect very high selectivity towards N2 is achieved. On the other hand, with hydrogen in excess the formation of ammonia increases notably, although NOx storage capacity is practically maintained at maximum and almost total reduction conversion is achieved. The maximum global NSR efficiency (percentage of N2 at the exit related to NO at the entry) is achieved just at the stoichiometric point, when the amount of H2 is neither in defect nor in excess. The amount of hydrogen fed during the rich period is proportional to the product CH2×tRCH2×tRso that this amount can be controlled by managing either H2 concentration or duration of the regeneration period. In fact, there exist different combinations (CH2,tR)(CH2,tR) which achieve similar NSR efficiency. The locus of these combinations conforms the isoeffiency curve map with NSR efficiency as the response parameter.
The combined analysis of temperature (100-420 ºC) and H2 concentration (0.4-3 %), maintaining lean and rich period times in 145 and 25 s respectively, has allowed to find the maximum storage capacity at intermediate temperature (~240 ºC) and high reductant concentration (>2 % H2). Maximum selectivity to N2 has been obtained operating at high temperature (>300 ºC) and hydrogen in defect (<1 % H2). The optimal control is performed at intermediate position, i.e. 270 ºC and 1 % H2, at which the maximum global NSR efficieny is achieved.