
You press the accelerator to merge onto a highway. One vehicle feels eager the moment you move your foot; another needs more revs before it gathers speed, yet pulls strongly once the engine is spinning. Both may have similar horsepower figures, but they do not feel the same from the driver’s seat.
That difference starts with torque and engine speed. These two quantities describe different parts of an engine’s behavior, and together they determine power—the rate at which useful work can be delivered.
Horsepower is often treated as the single performance number that matters. It is useful, particularly for comparing high-speed acceleration potential, but it does not explain everything about towing, launch feel, gearing, drivability, or why an electric vehicle can feel so immediate.
The key is not to choose torque or horsepower. It is to understand the formula that connects them, then see how gearing and operating speed turn engine output into vehicle motion.
🔧 Start with the Everyday Meaning of Engine Performance
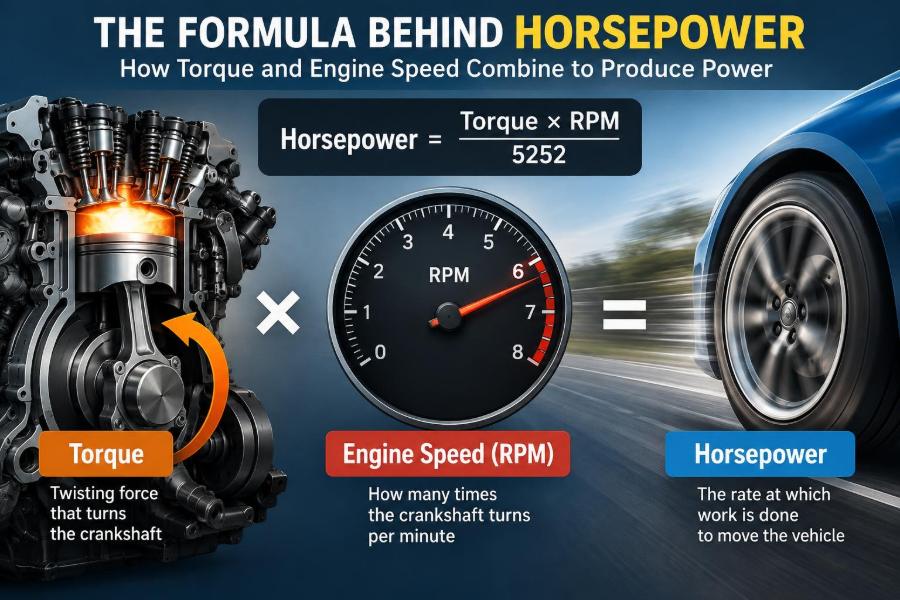
Engines make a twisting effort at the crankshaft. That twisting effort is torque. The crankshaft rotates, sending torque through the clutch or torque converter, transmission, final drive, differential, and wheels.
But a twisting effort alone does not tell us how quickly work is being done. Turning a shaft hard but slowly is different from turning it hard and rapidly. Power accounts for both.
A useful analogy is climbing stairs. Carrying a heavy box represents force or torque-like effort. Carrying that box up the same flight of stairs in half the time requires twice the power.
🌀 What Torque Actually Measures
Torque is a rotational moment: the turning effect produced by a force acting at a distance from an axis. Its SI unit is the newton-metre (N·m), while automotive specifications may also use pound-feet (lb-ft).
Imagine using a wrench on a bolt. Pushing harder creates more torque. Using a longer wrench also creates more torque because the same force acts farther from the bolt’s center.
Inside an internal-combustion engine, combustion pressure pushes the pistons down. The connecting rods and crankshaft convert that linear force into crankshaft torque. The torque value changes continuously with engine speed, throttle opening, air density, fuel delivery, and many other conditions.
⚡ What Power Actually Measures
Power is the rate of doing work. In an engine, it describes how quickly the crankshaft can deliver rotational work. The SI unit is the watt; automotive power is commonly stated in kilowatts (kW), metric horsepower (PS), or mechanical horsepower (hp).
One mechanical horsepower is conventionally about 746 watts. Metric horsepower is slightly smaller, so a specification written as “hp” should be read carefully when comparing vehicles from different markets.
Power is not a physical substance stored in the engine. It is a calculated rate at a particular operating condition. An engine may produce one power value at 2,000 rpm and a much higher or lower value at 6,000 rpm.
🧮 The Core Formula Connecting Torque and Power
In SI units, the fundamental relationship is:
Power (W) = Torque (N·m) × Angular speed (rad/s)Engine speed is normally displayed in revolutions per minute, or rpm, rather than radians per second. Converting rpm gives the practical automotive form:
Power (kW) = Torque (N·m) × RPM / 9550For common US customary units, the equivalent relationship is:
Horsepower (hp) = Torque (lb-ft) × RPM / 5252The constants 9550 and 5252 are unit-conversion results. They are not engine-specific magic numbers; they simply connect the chosen torque, speed, and power units.
📍 Why Torque and Horsepower Curves Meet at 5,252 RPM
When torque is measured in lb-ft and power in mechanical horsepower, the formula uses 5,252 rpm. At exactly that speed, the numerical values of torque and horsepower are equal.
For example, if an engine produces 250 lb-ft at 5,252 rpm, it produces 250 hp at that point. Above 5,252 rpm, the horsepower number will be larger than the lb-ft number if torque is plotted on matching numerical scales; below it, torque will be larger.
This crossing is a unit-system consequence, not a special point in engine operation. It does not mean the engine suddenly changes character at 5,252 rpm. With N·m and kW, there is no equally memorable matching number.
📈 Reading a Torque Curve
A torque curve shows crankshaft torque across the engine’s rpm range, usually at full throttle. It reveals where the engine produces its strongest twisting effort and how broad that useful region is.
A broad, nearly flat torque curve can make a vehicle feel relaxed in normal driving because useful torque is available without needing high rpm. A sharply peaked curve may reward keeping the engine within a narrower rev range.
Drivers often focus on peak torque, but the shape around that peak matters more than the isolated maximum. Torque available from 1,500 to 4,000 rpm can influence everyday response more than a short-lived maximum at one engine speed.
📊 Reading a Power Curve
A power curve is derived from torque and rpm. It normally continues climbing after peak torque because engine speed is still increasing quickly enough to outweigh a moderate torque decline.
Power reaches its peak only when the reduction in torque becomes large enough that additional rpm can no longer compensate. This is why an engine can make peak torque in the midrange but peak horsepower near the top of its rev range.
For acceleration at a given road speed, the power available at the wheels is a particularly useful indicator. It helps explain why performance-oriented engines are designed to keep producing useful power at high rpm.
🔢 A Simple Hypothetical Calculation
Consider a hypothetical engine producing 300 N·m at 3,000 rpm. Applying the SI formula:
Power = 300 × 3000 / 9550 = about 94 kWNow imagine it produces 250 N·m at 6,000 rpm. Torque has fallen, but power becomes:
Power = 250 × 6000 / 9550 = about 157 kWThe second condition makes less torque, yet substantially more power because the shaft is turning twice as fast. This is the formula in action, not a contradiction.
🚦 Why Torque Feels Strong During Normal Driving
At low road speeds, drivers notice how promptly a vehicle responds to throttle input. Strong low-rpm engine torque, combined with a short gear ratio, can create a forceful initial sensation.
That sensation is real, but it should not be confused with a complete measure of acceleration. A vehicle that feels strong at 1,500 rpm may still be outpaced at higher speeds by one that can sustain more wheel power over a wider speed range.
Turbocharged diesel engines and many electric motors are known for this immediate response. Their broad low-speed torque can reduce the need for downshifts in ordinary traffic.
🏁 Why Power Matters for Continued Acceleration
Once a vehicle is moving, acceleration depends on the net force at the tires after rolling resistance, aerodynamic drag, gradients, and drivetrain losses are considered. At a given vehicle speed, the ability to keep adding kinetic energy depends closely on wheel power.
Higher power can maintain stronger acceleration as speed rises, provided the transmission keeps the engine near a productive part of its power curve. This is why high-performance engines often use higher rev limits and closely spaced gears.
Aerodynamic drag rises rapidly with speed, and the power needed to overcome it rises even more rapidly. At high speed, horsepower becomes especially relevant because the vehicle needs a high rate of energy delivery simply to push air aside.
⚙️ The Transmission Changes Torque, Not Engine Power
Gears multiply torque. A low first gear can turn modest crankshaft torque into much greater torque at the wheels, helping a vehicle start from rest or climb a steep grade.
There is a trade-off: when a gear multiplies torque, it reduces wheel rotational speed relative to engine speed. In an ideal gearbox, power remains the same through the ratio. Real gearboxes lose a small portion of power through friction, oil churning, pumps, and other effects.
This is why saying “more engine torque always means faster acceleration” is incomplete. A lower-torque, higher-revving engine can use a shorter ratio to produce comparable wheel torque while maintaining greater power at higher vehicle speeds.
🛞 Wheel Torque Is the Force You Actually Use
Engine torque is measured at the crankshaft. The tires, however, respond to torque at the driven wheels. Wheel torque is approximately engine torque multiplied by the selected gear ratio and final-drive ratio, then reduced by drivetrain losses.
Wheel force is then found by dividing wheel torque by the effective rolling radius of the tire. Smaller-radius tires increase force for a given wheel torque, although they also alter gearing, speedometer calibration, ride, and other characteristics.
The tires can only transmit a finite amount of force before they slip. More wheel torque is useful only while traction, vehicle balance, and drivetrain strength can support it.
🧷 A Gear-Ratio Example
Suppose a hypothetical engine produces 200 N·m. In a 3.5:1 first gear with a 4.0:1 final drive, the ideal multiplication is 14:1. Before losses, the wheels receive about 2,800 N·m.
In a 1:1 gear with the same final drive, the multiplication becomes 4:1, producing about 800 N·m at the wheels. The car needs less wheel torque at higher road speeds because the engine is spinning faster for a given vehicle speed in the lower gear.
This example also shows why comparing brochure torque figures without knowing gearing tells only part of the story.
🔄 What Happens During an Upshift
An upshift drops engine rpm. The important question is whether the next gear places the engine at a point where it can deliver more wheel force or wheel power than it would have delivered by staying in the current gear.
For maximum acceleration, the best shift point is not automatically peak horsepower. It depends on the power curve and the rpm drop between gears. Racers and calibration engineers examine the wheel-power curves in adjacent gears.
In a road car, shift logic also considers smoothness, noise, fuel consumption, emissions control, component protection, and driver demand. The fastest theoretical shift is not always the most appropriate shift.
🛠️ Why Peak Numbers Can Mislead
“Peak torque” and “peak horsepower” are easy to advertise because they fit in a short specification line. They do not show how the engine behaves between idle and redline.
Two engines can have the same peak horsepower but very different driving characters. One may build power smoothly across a broad range, while the other may deliver its best output only near redline.
Useful questions include: At what rpm is the peak reached? How much torque is available at common cruising speeds? How quickly does output fall after the peak? What ratios does the transmission use?
🌬️ Why Naturally Aspirated Engines Build Output Differently
A naturally aspirated engine relies on atmospheric pressure and piston motion to fill its cylinders. Its torque curve is strongly shaped by intake and exhaust tuning, valve timing, engine displacement, airflow restriction, and volumetric efficiency.
Many naturally aspirated performance engines make their best power at high rpm because they are designed to breathe effectively there. They may require downshifts to access strong acceleration, which can be engaging but less effortless in everyday driving.
At very high rpm, friction, pumping losses, and reduced time for cylinder filling can eventually limit torque. Power then peaks and declines even if the engine is still capable of revving higher.
🌀 How Turbocharging Reshapes the Curve
A turbocharger uses exhaust-gas energy to drive a compressor that increases intake-air density. More air allows more fuel to be burned safely, increasing potential torque.
Modern turbocharged engines can deliver strong midrange torque because boost is available over a broad rpm range. However, turbo response depends on turbine size, control strategy, exhaust energy, boost limits, temperature, and transient conditions.
Turbocharging does not create free power. Higher cylinder pressures and temperatures place greater demands on cooling, fuel quality, knock control, lubrication, and component design. Manufacturers balance response, efficiency, emissions, durability, and cost.
🔋 Why Electric Motors Change the Conversation
Electric motors can produce high torque from zero or very low speed, which gives many electric vehicles crisp launch response. Their control systems can also adjust motor torque extremely quickly.
Yet electric motors still obey the same power relationship: power equals torque times rotational speed. In a typical traction motor, torque is high at lower motor speeds and power is roughly constant across part of the higher-speed range before declining.
Many EVs use a single reduction gear because the motor has a wide usable speed range. Some use multiple ratios or multiple motors when performance, towing, efficiency, or top-speed requirements justify additional complexity.
🌡️ Temperature, Altitude, and Heat Soak
Engine output is not perfectly fixed. Hot intake air is less dense than cool air, and high altitude reduces atmospheric pressure. Both conditions can reduce the oxygen available for combustion, especially in naturally aspirated engines.
Turbocharged engines can compensate for some altitude-related loss by increasing boost within safe operating limits, but they are still constrained by turbo speed, compressor temperature, cooling capacity, knock resistance, and control limits.
Repeated hard acceleration can also raise intake, coolant, oil, exhaust, and transmission temperatures. Many vehicles reduce output or alter shifting when temperatures approach protective thresholds. A published peak figure may not represent sustained output in every environment.
🧪 How Engineers Measure Torque and Power
Engines are commonly tested on an engine dynamometer, where a controlled absorber measures torque at the crankshaft or output shaft across a range of rpm. Power is then calculated from torque and speed.
A chassis dynamometer measures output at the driven wheels or rollers. Its result includes drivetrain losses and is influenced by tire condition, tie-down method, cooling airflow, calibration, and test procedure.
Different dynamometers and correction methods can produce different results. Therefore, dyno graphs are most meaningful when comparing runs made on the same equipment under similar conditions, rather than treating every number from every source as directly interchangeable.
📏 Crankshaft Power Versus Wheel Power
Manufacturers usually quote engine power at the crankshaft under a defined test standard. Wheel power is lower because energy is lost in the transmission, differential, bearings, seals, tires, and auxiliaries.
There is no universal single drivetrain-loss percentage that applies to every car. Losses vary with layout, gear selection, temperature, lubricant, load, and whether the vehicle has front-, rear-, or all-wheel drive.
When discussing modifications, distinguish clearly between crank figures and wheel figures. Confusing them can make comparisons look more dramatic than they really are.
🧠 The Area Under the Curve Matters
For a fixed rpm band, an engine with more average torque produces more average power in that band. This is why engineers and drivers often care about the area under the power curve, not merely the highest point.
A broad power band lets the transmission keep the engine productive between shifts. A narrow power band may need closer ratios and more frequent shifting to achieve similar acceleration.
For daily driving, a broad torque band may be preferable because it offers flexible response with fewer downshifts. For track use, a high-rpm engine can work exceptionally well if its ratios keep it near peak power.
🚚 Towing, Payload, and Low-Speed Pulling
Towing demands substantial wheel force at low vehicle speeds, particularly on grades. Low gearing, sufficient engine torque at practical rpm, cooling capacity, transmission calibration, and vehicle mass all matter.
A high peak horsepower figure alone does not guarantee comfortable towing. An engine that requires very high rpm to make its power may still tow effectively, but it can feel busier and may demand more gear changes than one with a broad low-speed torque plateau.
Always follow the vehicle manufacturer’s rated towing limits. Those limits reflect more than engine output, including chassis, brakes, cooling, suspension, hitch equipment, and legal requirements that vary by location.
⛽ Power, Efficiency, and Fuel Consumption
Making more power generally requires burning more fuel per unit time in a combustion engine, because more chemical energy must be released. But fuel economy is not determined by peak horsepower alone.
At steady cruising speed, a vehicle needs only enough power to overcome drag, rolling resistance, and drivetrain losses. Engine efficiency, gear ratio, vehicle mass, aerodynamics, accessory loads, and driving style strongly affect fuel use.
Downsized turbocharged engines can provide good low- and midrange torque, but under heavy boost they may consume fuel rapidly. Conversely, a larger naturally aspirated engine may operate efficiently under some light-load conditions yet use more fuel when its displacement is unnecessary. The real outcome depends on the duty cycle.
🧩 Common Misconception: Torque Wins, Horsepower Wins
Neither slogan is complete. Torque is essential because it is the direct rotational output from the engine, and gearing converts it into wheel force. Power is essential because it captures how much work can be delivered per unit time.
For comparing acceleration across varying speeds and gears, power is usually the more revealing high-level quantity. For launch feel, towing behavior, drivability, and mechanical loading, torque and gear ratios provide indispensable context.
The accurate statement is simpler: torque and rotational speed create power, while gearing determines how that output reaches the tires.
🚫 Common Mistake: Comparing Different Units Carelessly
A torque figure in N·m cannot be compared numerically with one in lb-ft without conversion. Likewise, kW, hp, and PS are close but not identical power units.
Be careful with phrases such as “more torque than horsepower.” They may compare numbers expressed in different units and at different rpm values, making the statement meaningless as a performance conclusion.
When comparing specifications, check the unit, rpm, test condition, and whether the value is engine output or wheel output. A neat number without those details is only partial information.
🔍 Common Mistake: Ignoring Vehicle Mass and Aerodynamics
Power does not accelerate an engine in isolation; it accelerates a whole vehicle. A lighter vehicle generally needs less force to gain speed, while a heavier one may need more power to achieve similar performance.
At higher speeds, aerodynamic drag becomes a major limitation. Two vehicles with equal power can have very different top-speed and high-speed-acceleration behavior because their drag area differs.
Tire grip, suspension geometry, traction control, launch strategy, and road surface also influence real acceleration. The engine’s dyno chart is vital, but it is not the entire vehicle story.
🧰 Common Mistake: Chasing a Single Modification Number
An intake, exhaust, turbo upgrade, remap, or camshaft change can alter torque and power, but the result should be judged across the operating range. A modification that adds a little peak power may reduce low-speed response, increase heat, worsen drivability, or exceed the limits of supporting components.
Fuel quality, calibration, emissions compliance, engine knock margin, clutch or transmission capacity, and cooling all deserve attention. Modifications should be evaluated with reliable measurement and an understanding of the intended use.
For road vehicles, legality and insurance implications may also apply. More output is not automatically a better engineering solution if reliability, controllability, or safety are compromised.
🗺️ A Practical Way to Compare Two Vehicles
Start with the power and torque curves rather than the headline peaks. Then look at vehicle mass, gear ratios, tire size, driven wheels, and the rpm range available after an upshift.
- Compare power at the rpm likely to be used, not only at peak.
- Check whether one transmission has much shorter ratios.
- Consider low-speed response separately from high-speed acceleration.
- Account for intended use: commuting, towing, track driving, or highway travel.
- Use independent performance testing cautiously, noting weather and test conditions.
This approach produces a more realistic assessment than declaring a winner based on one torque or horsepower number.
📐 Useful Conversions for Engineering Work
| Quantity | Approximate conversion | Practical use |
|---|---|---|
| 1 kW | 1.341 mechanical hp | Convert SI power to US customary horsepower |
| 1 mechanical hp | 0.746 kW | Convert horsepower to kilowatts |
| 1 lb-ft | 1.356 N·m | Convert torque to SI units |
| 1 N·m | 0.738 lb-ft | Convert torque to customary units |
Use adequate precision in calculations and round only at the end. Published vehicle specifications may be rounded differently, so small apparent differences are not always meaningful.
📝 A Reliable Calculation Workflow
When working from an engine map, dyno sheet, or design problem, use a consistent sequence:
- Identify the torque value and the rpm at which it occurs.
- Confirm the units before selecting a formula.
- Calculate power from torque and rpm.
- If analyzing the vehicle, apply gear and final-drive ratios to estimate wheel torque.
- Divide by tire rolling radius to estimate tire force.
- Subtract resistance forces when estimating acceleration.
This workflow keeps crankshaft behavior, drivetrain multiplication, and vehicle-level performance from being mixed together.
🎯 The Core Principle to Remember
Torque describes the crankshaft’s twisting effort. Engine speed describes how rapidly that shaft turns. Their product determines power, which describes the rate at which the engine can deliver work.
Gears can multiply torque at the wheels, but they exchange torque for rotational speed and cannot create extra power. That is why torque curves, power curves, gearing, traction, mass, and aerodynamic drag must be considered together.
Once this relationship is clear, specification sheets become easier to read. A high torque number, a high horsepower number, or a high rev limit is not automatically superior; each has meaning only within the complete powertrain and vehicle design.
Horsepower is not separate from torque: it is torque applied at a particular engine speed. Understanding that one relationship turns a confusing performance debate into a practical engineering calculation. 🚗⚙️📈